Free pharmacy material

High-Performance Liquid Chromatography
INTRODUCTION
High-Performance Liquid Chromatography (HPLC) method was first developed in the early 1970s based on the principles of traditional chromatographic techniques especially from column chromatography. The technique is based on the pumping of mobile phase through the packed column under high-pressure. Hence it is also called as high-pressure liquid chromatography. This method was first proposed by Kirkland and Huber. They proposed high-pressure systems capable of operating at pressures up to 3000 psi.
The high-pressure liquid chromatography is a method of separation in which stationary phase contained in one end of the column and other end of the column is attached to a source of pressurised liquid eluent (mobile phase).
TYPES OF HPLC TECHNIQUES
HPLC techniques are classified on the following types:
- Based on the modes of chromatography (based on the polarity of stationary and mobile phase):
- Normal phase mode: Stationary phase is polar e.g., silica gel and mobile phase is non-polar.
- Reverse phase mode: Stationary phase is non-polar and mobile phase is polar.
- In normal phase mode, non-polar compounds travel faster and are eluted first. This is because of less affinity between solute and stationary phase. Polar compounds are retained longer time in the column because of more affinity towards stationary phase and take more time to elute.
- In reverse phase mode, polar compounds get eluted first and non-polar compounds are retained for a longer time. Since most of the drugs and pharmaceuticals are polar in nature and not retained for a longer time and eluted faster.
- Based on the principle of separation:
- Adsorption chromatography: Separation of compounds based on the difference in affinity of compounds towards stationary phase. Most widely used stationary phase is unmodified silica which allows high efficiency and high permeability. The functional group responsible for adsorption is silanol group which reacts with sample solutes by hydrogen bonding.
- Ion exchange chromatography: Separation of compounds based on ion exchange of functional groups. In this ion exchange, resins are used to separate a mixture of similar charged ions. The retention of the ions on the column depends on the ionic strength and PH of the mobile phase. Types of ion exchangers include the following:
- Polystyrene resins: These allow cross linkage which increases the stability of the chain. Higher cross linkage reduces swerving, which increases the equilibration time and ultimately improves selectivity.
- Cellulose and dextran ion exchangers (gels): These possess larger pore sizes and low charge densities making them suitable for protein separation.
- Controlled-pore glass or porous silica: In general, ion exchangers favour the binding of ions of higher charge and smaller radius.
- Ion pair chromatography: In this reverse phase, column is converted temporarily into ion exchange column using compounds such as pentane or hexane or heptanes or octane with sulphonic acid sodium salt, tetra methyl or ethyl ammonium hydroxide.
- Size exclusion chromatography (gel permeation chromatography): Separation is based on the different molecular size compounds separated by using different gels.
- Example: Dextran, agarose, polyacrylamide gels. This technique is widely used for the determination of molecular weight of polysaccharides.
- Affinity chromatography: Separation is based on the affinity of the sample with specific stationary phases.
- Chiral phase chromatography: Separation of optical isomers using chiral stationary phases.
- Based on elution technique:
- Isocratic separation: Same mobile-phase combination is used throughout the process of separation.
- Gradient separation: Mobile-phase combination of lower polarity or elution strength is used followed by gradually increasing the polarity or elution strength.
- Based on scale of operation:
- Analytical HPLC
- Example: Analysis of samples (μg).
- Preparative HPLC
- Example: Individual fractions of samples are analysed (mg).
- Based on the type of analysis:
- Qualitative analysis:
- Example: Identification of compounds, detection of impurities, the presence of number of compounds.
- Quantitative analysis:
- Example: Quantity of sample.
INSTRUMENTATION FOR HPLC
The essential features of HPLC instrumentation are the following:
- A solvent delivery system (pumps)
- Sample injection system
- A chromatographic column
- A detector
- Recording system
 |
| hplc |
Schematic flow chart of HPLC
- A solvent delivery system (pumps): The pumps are mainly used to pump the mobile phase. These are mainly used to deliver the mobile phase in the rate of 15 ml/min. The mobile phase is pumped under pressure from reservoir and flows through the column at a constant rate. It is necessary to deaerate the mobile phase using a vacuum pump. The elution power of the mobile phase depends on the polarity of the mobile phase, stationary phase and the nature of the sample. In normal phase, separations eluting power increase with the polarity and in reverse phase, eluting power decreases with the polarity. The ideal characteristics of the pump are the following:
- It should be non-corrosive.
- It should be compatible with the solvent.
- It should provide the suitable pressure for the solvent flow.
- It should provide constant flow rate.
Factors Affecting the Efficient Separation
- Boiling point
- Viscosity
- Detector compatibility
- Flammability
- Toxicity
- The pump directly affects the retention time, reproducibility and detector sensitivity. The pump should be capable of delivering the mobile phase at flow rates of 1–5 ml/min and pressure of 5000 psi.
- There are mainly two types of pumps. They are as follows:
- Constant pressure pumps
- Example: Displacement type pumps.
- Constant volume pumps
- Example: Reciprocating pumps and syringe pumps.
- Displacement type pumps: This possesses limited reservoir and offers non-pulsating flow.
- The reciprocating type pumps: This has an unlimited reservoir and provides pulsating flow.
- A pressure vessel pumps (pneumatic pumps): This has limited reservoir and gives non-pulsating flow.
- Syringe type pumps: These pumps are reliable although they are expensive.
- Among these reciprocating pumps are widely used.
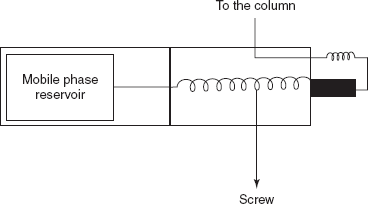
- Displacement type pumps: It consists of screw or plunger is driven by the motor. The rotatory movement of the pump provides the continuous movement of the mobile phase. This is propelled by the revolving screw and pushes solvent through the needle into the column. The advantage of this pump is the independent of the back pressure and simple operation. The main disadvantage is the limited solvent capacity.
- Displacement type pump
- Reciprocating pumps: In these types of pumps, the piston moves front and back in the hydraulic chamber. This allows the flow of solvent into the column under high pressure. By moving the piston front and back produces the base line noise which is the basic disadvantage of this type of pumps. The advantages of this type of pump are high output pressure and ready adaptability to gradient elution.
- Reciprocating type pump
- Pneumatic pumps: Pneumatic pumps are the simplest where as the mobile phase is pushed out of the mobile-phase container by the pressure from the gas cylinder by a piston. The flow is dependent on the back pressure of the column and usually the flow is limited to pressures below 2000 psi. The advantage is pulse free flow and generates high pressure. The disadvantage is the limited volume capacity such as 70 ml.
hplc - Pneumatic pump
- Syringe type pumps: The principle is positive solvent displacement by a piston mechanically driven at a constant rate in a piston chamber of about 250–500 ml capacity with the generation of pulse-less flow with high-pressure capabilities.
- Syringe type pumps
- Pulse damper: The following are the techniques used for the pulse dampening:
- By using the triple head pump: In which the two heads are filled in different stages and the third head is used for the pumping.
- By using the tube with an air space: In which the flexible metal vessel takes the solution energy. When the pump refills, the energy is released which allow smooth pressure pulsation result.
- By using the restrictor: In this, a restrictor composed of the stainless steel tube packed with the glass beads is placed between the pump and the column.
- Sample injection system: The ideal method for the sample introduction is that the sample is injected through a narrow column so that the peak broadening is negligible.
- Six-port injection valve schematic diagram
- The sample injection port contains the six-port valve. In the load position, the mobile phase flows directly to the column through the one pair of the ports. Then the other ports drain the sample from the sample loop. Then the rotation of the valve to the inject position directs the mobile-phase flow into the sample loop and injects the sample into the column.
- The most widely used modes are those based on sampling valves and loops. Here the sample loop is filled with sample by means of a syringe. A rotation of the valve rotor causes the eluent stream to pass through the sample loop thus injecting the sample into the column without interrupting the flow.
- Simply the sample is first loaded into an external loop in the valve and then introduced into the mobile phase by rotating the valve. Automatic sample injectors are available commercially.
- The column: Columns are made up of stainless steel or heavy glass which with stands to the high pressure. Columns are usually narrow tubes packed with the 25 μm particles. The internal portion of the column should be smooth and uniform. Column dimensions in the range from 10 to 25 cm long and about 4.6 mm internal diameter. Pellicular or porous packing materials are usually used. Pellicular packings are nonporous glass or polymer beads ranging from 30 to 40 μm. Porous packings are mostly silica based with particle diameters from 3 to 10 μm. The columns are of three types:
- Analytical columns.
- Preparative columns.
- Guard columns.
- The packing used in modern HPLC consists of small, rigid particles having a narrow particle size. There are mainly three types of column packings. They are as follows:
- Porous, polymeric beads based on styrene–divinyl benzene co-polymers. These are mainly used for ion exchange and size exclusion chromatography. Nowadays, these are replaced by silica based packings which are more efficient and mechanically more stable.
- Porous layer beds consisting of a thin shell of silica or modified silica on a spherical inert core.
- Totally porous silica particles with narrow particle size (diameter <10 μm) range.
- The life of the column can be increased by introducing Guard column. It is a short column which is placed between the injector and the column. The guard column protects the column from damage or loss of efficiency caused by particulate matter or strongly adsorbed substances in sample or solvents. This is mainly used to remove the particles which are clogged the separation column or which causes the baseline drift, decreased resolution, decreased sensitivity, etc.
- The internal diameter (ID) of an HPLC column is an important parameter that influences the detection sensitivity and separation selectivity in gradient elution. It also determines the quantity of analyte that can be loaded onto the column. Larger columns are usually seen in industrial applications, such as the purification of a drug product for later use. Low-ID columns have improved sensitivity and lower solvent consumption at the expense of loading capacity.
- Larger ID columns (over 10 mm) are used to purify usable amounts of material because of their large loading capacity.
- Analytical scale columns (4.6 mm) have been the most common type of columns, though smaller columns are rapidly gaining in popularity. They are used in traditional quantitative analysis of samples and often use an UV–Vis absorbance detector.
- Narrow-bore columns (1–2 mm) are used for applications when more sensitivity is desired either with special UV–Vis detectors, fluorescence detection or with other detection methods like liquid chromatography–mass spectrometry.
- Capillary columns (under 0.3 mm) are used almost exclusively with alternative detection means such as mass spectrometry. They are usually made from fused silica capillaries, rather than the stainless steel tubing that larger columns employ.
- Detectors: Detector can be classified as the following:
- Bulk property detectors
- Solute property detectors
- Bulk detectors respond to physical property of the mobile phase such as refractive index, dielectric constant, conductivity, etc., which is modified in the presence of a solute.
- The solute property detectors respond to a property of the solute such as its UV–Vis absorption, fluorescence, chemiluminescence, etc., that is not possessed by the mobile phase.
- Electrochemical detectors: These detectors respond to a change in an electrochemical property. The simplest is the conductivity detector which responds to changes in the conductivity of the mobile phase in the presence of an analyte.
- Conductivity detection: Conductivity detection is based on the conductance of an eluent prior to the elution of an analyte.
- Amperometric detection: This is mainly used for ions which have a PK of above 7. These are mainly consists of three electrodes which contain a working electrode, reference electrode and counter electrode. The potential required for oxidation or reduction of the substance being analysed is applied between the working electrode and the Ag/AgCl reference electrode. A glassy carbon electrode acts as a counter electrode. The detector functions when an electrochemically active substance flows through the measuring cell is partially oxidised or reduced. This produces an anodic or cathodic current which is proportional to the concentration of analyte. This signal is converted to chromatographic peak.
- Potentiometric detection: Potentiometry is the process by which the potential difference at an indicator electrode with reference to the reference electrode at constant current. Potentiometric detection found wide applicability in aqueous solutions of which ion selective electrodes are generally used.
- Spectroscopic detectors:
- UV detectors: UV detectors measure the change in the UV absorption as the solute passes through the flow cell. In a UV transparent solvent UV, detectors are concentration sensitive.
- Refractive index detectors: The refractive index of a medium is the ratio of the speed of light in vacuum to the speed in medium. These measures change in refractive index in the eluent as the solute passes through the sample cell. This method of detection is less sensitive than UV detection although non-chromatographic compounds can be measured directly without derivatisation.
- Flourometric detection: In this system, the solute is excited by UV radiation at a particular wavelength and the emission wave length is detected.
- Recording system: The output will be recorded as a series of peaks—each one representing a compound in the mixture passing through the detector and absorbing UV light. As long as you were careful to control the conditions on the column, you could use the retention times to help to identify the compounds present—provided, of course, that you (or somebody else) had already measured them for pure samples of the various compounds under those identical conditions.
- However, you can also use the peaks as a way of measuring the quantities of the compounds present. Let us suppose that you are interested in a particular compound, X.
- If you injected a solution containing a known amount of pure X into the machine, not only could you record its retention time, but you could also relate the amount of X to the peak that was formed.
- The area under the peak is proportional to the amount of X which has passed the detector, and this area can be calculated automatically by the computer linked to the display. The area it would measure is shown in green in the (very simplified) diagram.
- If the solution of X was less concentrated, the area under the peak would be less—although the retention time will still be the same. For example:
- Low concentration solution peak
- This means that it is possible to calibrate the machine so that it can be used to find how much of a substance is present—even in very small quantities.
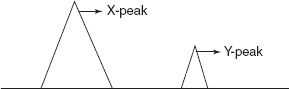
- The peak for the X and Y substances
- In the diagram, the area under the peak for Y is less than that for X. That may be because there is less Y than X, but it could equally well be because Y absorbs UV light at the wavelength you are using less than X does. There might be large quantities of Y present, but if it only absorbed weakly, it would only give a small peak.
- Parameters: Several factors affect efficiency in chromatographic techniques including:
- Particle size
- Flow rate
- Thickness of stationary phase
- Mobile-phase viscosity
- Diffusion of solute in mobile and stationary phases
- Column packing
- Sample size (μg sample/g packing)
- Particle size: In the HPLC, the stationary phase attached to the outside of small spherical silica particles (very small beads). These particles from 5 μm size beads are the most commonly available. Smaller particles generally provide more surface area and better separations, but the pressure required for optimum linear velocity increases by the inverse of the particle diameter squared.
- This means that changing to particles that are half as big, keeping the size of the column the same, will double the performance, but increase the required pressure by a factor of 4. Larger particles are used in preparative HPLC (column diameters 5 cm up to >30 cm) and for non-HPLC applications such as solid-phase extraction.
- Pore size: Many stationary phases are porous to provide greater surface area. Small pores provide greater surface area while larger pore size has better kinetics, especially for larger analytes. For example, a protein which is only slightly smaller than a pore might enter the pore but does not easily leave once inside.
- Pump pressure: Pumps vary in pressure capacity, but their performance is measured on their ability to yield a consistent and reproducible flow rate. Pressure may reach as high as 40 MPa (6000 lbf/in2), or about 400 atmospheres.
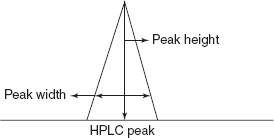
- Retention time: The time taken for a particular compound to travel through the column to the detector is known as its retention time. This time is measured from the time at which the sample is injected to the point at which the display shows a maximum peak height for that compound.
- Different compounds have different retention times. For a particular compound, the retention time depends on the following:
- The pressure used (because that affects the flow rate of the solvent).
- The nature of the stationary phase (not only what material it is made of but also particle size).
- The exact composition of the solvent.
- The temperature of the column.
- Capacity factor: The capacity factor K’ of a compound is its retention behaviour on a column.
- where Vr is the distance along the base line between the point of injection and a perpendicular dropped from maximum of the peak of interest; V0 is the distance along the base line between the point of injection and a perpendicular from the maximum of an unretained peak.
- A small value of K shows that the compound is poorly retained and elutes near the void volume. Larger K values imply a good separation. Ideal separation will be a capacity factor of between 1 and 5.
- Resolution: The aim of chromatography is to separate components in a mixture into bands or peaks as they migrate through the column. Resolution is a measure of the ability of a column to separate analytes. This measurement is obtained by the retention times and peak widths which are directly obtained from the chromatogram.
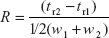
- In general, resolution is the ability to separate two signals. In terms of chromatography, this is the ability to separate two peaks. Resolution, R, is given by
- where tr1 and tr2 are times of the two adjacent peaks; w1 and w2 are widths of the two adjacent peaks.
- If the two peaks are same then w is nearly the same for both peaks and resolution may be expressed as the following:
- If the distance between the peaks is 4σ, then R is 1 and 2.5 per cent of the area of the first peak overlaps 2.5 per cent of the area of the second peak. A resolution of unity is minimal for quantitative analysis using peak areas.
- Theoretical plates: The number of theoretical plates in a column, N (the more plates the better), or by stating the plate height; the Height Equivalent to a Theoretical Plate (the smaller the better). If the length of the column is L, then the HETP is
- HETP = L/N
- The number of theoretical plates that a real column possesses can be found by examining a chromatographic peak after elution:
- where w1/2 is the peak width at half-height.


THE RATE THEORY OF CHROMATOGRAPHY
The resulting band shape of a chromatographic peak is affected by the rate of elution. It is also affected by the different paths available to solute molecules as they travel between particles of stationary phase. By considering the various mechanisms which contribute to band broadening is given by the Van Deemter equation for plate height
HETP = A + B/u + Cu
where u is the average velocity of the mobile phase; A, B and C are factors which contribute to band broadening.
A is the Eddy diffusion: The mobile phase moves through the column which is packed with stationary phase. Solute molecules will take different paths through the stationary phase at random. This will cause broadening of the solute band, because different paths are of different lengths.
B is the longitudinal diffusion: The concentration of analyte is less at the edges of the band than at the centre. Analyte diffuses out from the centre to the edges. This causes band broadening. If the velocity of the mobile phase is high then the analyte spends less time on the column, which decreases the effects of longitudinal diffusion.
C is the resistance to mass transfer: The analyte takes certain amount of time to equilibrate between the stationary and mobile phase. If the velocity of the mobile phase is high and the analyte has a strong affinity for the stationary phase, then the analyte in the mobile phase will move ahead of the analyte in the stationary phase. The band of analyte is broadened. The higher the velocity of mobile phase, the worse the broadening becomes.
Van Deemter plots: A plot between plate height and average linear velocity of mobile phase.
Van deemter plot
Such plots are of considerable use in determining the optimum mobile-phase flow rate.
Selectivity Factor
A quantity called the selectivity factor, a, which describes the separation of two species (A and B) on the column
a = k′B/k′A
When calculating the selectivity factor, species A elutes faster than species B. The selectivity factor is always greater than one.
To obtain optimal separations, sharp, symmetrical chromatographic peaks must be obtained. This means that band broadening must be limited. It is also beneficial to measure the efficiency of the column.
Band broadening: Three reasons for intra column band broadening include the following:
- Multiple paths effects
- Longitudinal diffusion
- Mass transfer in stationary and mobile phases
However, there are other sources of band broadening unrelated to column materials and occur outside the column. These include several sources:
- Fittings dead volume
- Tubing length and diameter
- Detector volume
- Injection volume
Extra column band broadening becomes very important for small bore columns.
ADVANTAGES OF HPLC
- Speed (minutes)
- High resolution
- Sensitivity (ng to fg)
- Reproducibility of +/−1% (not so for LC)
- Accuracy
- Automation
DISADVANTAGES OF HPLC
- Cost
- Complexity
- Low sensitivity for some compounds
- Irreversibly adsorbed compounds not detected
- Co-elution is difficult to detect
HPLC TROUBLE SHOOTING
Start up—preliminary checks
Problem
|
Possible cause
|
Solution
|
No peaks or very small peaks
|
Detector off
|
Check detector
|
Broken connections to recorder
|
Check connections
| |
No sample/wrong sample
|
Check sample. Be sure it is not deteriorated. Check for bubbles in the vials
| |
Wrong settings on recorder or detector
|
Check attenuation. Check gain
| |
No flow
|
Pump off
|
Start pump
|
Flow interrupted
|
Check reservoirs. Check position of the inlet tubing. Check loop for obstruction or air. Check degassing of mobile phase. Check compatibility of the mobile-phase components
| |
Leak
|
Check fittings. Check pump for leaks and precipitates. Check pumps seals
| |
Air trapped in the system
|
Disconnect column and prime pump. Flush system with 100% methanol or isopropanol. Contact servicing if necessary
|
Column and fitting leaks
Problem
|
Possible cause
|
Solution
|
Column end leaks
|
Loose fitting. White powder at loose fitting
|
Tighten or replace fitting. Cut tubing and replace ferrule; diassemble fitting, rinse and reassemble
|
Leak at detector
|
Detector-seal failure
|
Replace detector seal or gaskets.
|
Leak at injection valve
|
Worn or scratched valve rotor
|
Replace valve rotor
|
Leak at pump
|
Pump seal failure
|
Replace pump seal; check piston for scratches and, if necessary, replace
|
Change in retention time
Problem
|
Possible cause
|
Solution
|
Changing retention times
|
Buffer retention times
|
Use buffer with concentration greater than 20 mm
|
Contamination buildup
|
Flush column occasionally with strong solvent
| |
Equilibration time insufficient for gradient run or changes in isocratic mobile phase
|
Pass at least 10 column volumes through the column for gradient regeneration or after solvent changes
| |
First few injections—active sites
|
Condition column by injecting concentrated sample
| |
Inconsistent on-line mobile-phase mixing
|
Ensure gradient system is delivering a constant composition; compare with manually prepared mobile phase; partially premix mobile phase
| |
Selective evaporation of mobile-phase component
|
Cover solvent reservoirs; use less-vigorous helium purging; prepare fresh mobile phase
| |
Varying column temperature
|
Thermostat or insulate column; ensure laboratory temperature is constant.
| |
Decreasing retention times
|
Active sites on column packing
|
Use mobile-phase modifier, competing base (basic compounds), or increase buffer strength; use higher coverage column packing
|
Column overloaded with sample
|
Decrease sample amount or use larger-diameter column
| |
Increasing flow rate
|
Check and reset pump flow rate
| |
Loss of bonded stationary phase or base silica
|
Use mobile-phase pH between 2 and 8
| |
Varying column temperature
|
Thermostat or insulate column; ensure laboratory temperature is constant
| |
Increasing retention times
|
Decreasing flow rate
|
Check and reset pump flow rate; check for pump cavitations; check for leaking pump seals and other leaks in system
|
Changing mobile-phase composition
|
Cover solvent reservoirs; ensure that gradient system is delivering correct composition
| |
Loss of bonded stationary phase
|
Use mobile-phase pH between 2 and 8
| |
Slow column equilibration time
|
Reversed phase ion pairing—long chain ion pairing reagents require longer equilibration time
|
Use ion-pairing reagent with shorter alkyl chain length
|
Baseline
Problem
|
Possible cause
|
Solution
|
Void time noise
|
Air bubbles in mobile phase
|
Degas or use back pressure restrictor on detector
|
Positive–negative—difference in refractive index of injection solvent and mobile phase
|
Normal with many samples; use mobile phase as sample solvent
| |
Drifting baseline
|
Negative direction (gradient elution)—absorbance of mobile-phase A
|
Use non-UV absorbing mobile phase solvents; use HPLC grade mobile-phase solvents; add UV absorbing compound to mobile-phase B
|
Positive direction (gradient elution)—absorbance of mobile-phase B
|
Use higher UV absorbance detector wavelength; use non-UV absorbing mobile-phase solvents; use HPLC grade mobile-phase solvents; add UV absorbing compound to mobile-phase A
| |
Positive direction—contamination buildup and elution
|
Flush column with strong solvent; clean up sample; use HPLC grade solvents
| |
Wavy or undulating—temperature changes in room
|
Monitor and control changes in room temperature; insulate column or use column oven; cover refractive index detector and keep it out of air currents
| |
Baseline noise
|
Continuous—detector lamp problem or dirty cell
|
Replace UV lamp (each should last 2000 h); clean and flush flow cell
|
Gradient or isocratic proportioning—lack of solvent mixing
|
Use proper mixing device; check proportioning precision by spiking one solvent with UV absorbing compound and monitor UV absorbance detector output
| |
Gradient or isocratic proportioning—malfunctioning proportioning valves
|
Clean or replace proportioning precision valves; partially remix solvents
| |
Occasional sharp spikes—external electrical interference
|
Use voltage stabiliser for LC system; use independent electrical circuit
| |
Periodic—pump pulses
|
Service or replace pulse damper; purge air from pump; clean or replace check valves
| |
Random—contamination buildup
|
Flush column with strong solvent; clean up sample; use HPLC grade solvent
| |
Spikes—bubble in detector
|
Degas mobile phase; use back pressure restrictor at detector outlet
| |
Spikes—column temperature higher than boiling point of solvent
|
Use lower column temperature
|
Pressure
Problem
|
Possible cause
|
Solution
|
Decreasing pressure
|
Insufficient flow from pump
|
Loosen cap on mobile phase reservoir
|
Leak in hydraulic lines from pump to column
|
Tighten or replace fittings; tighten rotor in injection valve
| |
Leaking pump check valve or seals
|
Replace or clean check valves; replace pump seals
| |
Pump cavitations
|
Degas solvent; check for obstruction in line from solvent reservoir to pump; replace inlet-line frit
| |
Fluctuating pressure
|
Bubble in pump
|
Degas solvent; purge solvent with helium
|
Leaking pump check valve or seals
|
Replace or clean check valves; replace pump seals
| |
High back pressure
|
Column blocked with irreversibly adsorbed sample
|
Improve sample cleanup; use guard column; reverse-flush column with strong solvent to dissolve blockage
|
Column particle size too small (for example, 3 μm)
|
Use larger particle size (for example 5 μm)
| |
Microbial growth on column
|
Use at least 10% organic modifier in mobile phase; use fresh buffer daily; add 0.02% sodium azide to aqueous mobile phase; store column in at least 25% organic solvent without buffer
| |
Mobile-phase viscosity too high
|
Use lower viscosity solvents or higher temperature
| |
Plugged frit in in-line filter or guard column
|
Replace frit or guard column
| |
Plugged inlet frit
|
Replace end fitting or frit assembly
| |
Polymeric columns—solvent change causes swelling of packing
|
Use correct solvent with column; change to proper solvent compositional consult manufacturer's solvent-compatibility chart use a column with a higher percentage of cross-linking
| |
Salt precipitation (especially in reversed-phase chromatography with high concentration of organic solvent in mobile phase); concentration of organic solvent in mobile phase)
|
Ensure mobile-phase compatibility with buffer concentration; decrease ionic strength and water–organic solvent ratio; premix mobile phase
| |
When injector disconnected from column—blockage in injector
|
Clean injector or replace rotor
| |
Increasing pressure
|
Blocked flow lines
|
Systematically disconnect components from detector end to column end to find blockage; replace or clean blocked component
|
Particulate buildup at head of column
|
Filter sample; use 0.5 μm in-line filter; disconnect and back flush column; replace inlet frit
| |
Water–organic solvent systems—buffer precipitation
|
Ensure mobile-phase compatibility with buffer concentration; decrease ionic strength or water organic solvent ratio
|
Peaks
Problem
|
Possible cause
|
Solution
|
Broad peaks
|
Analytes eluted early due to sample overload
|
Dilute sample 1:10 and reinject
|
Detector-cell volume too large
|
Use smallest possible cell volume consistent with sensitivity needs; use detector with no heat exchanger in system
| |
Injection volume too large
|
Decrease solvent strength of injection solvent to focus solute; inject smaller volume
| |
Large extra column volume
|
Use low- or zero-dead-volume end fittings and connectors; use smallest possible diameter of connecting tubing (<0.10 in. id); connect tubing with matched fittings
| |
Mobile-phase solvent viscosity too high
|
Increase column temperature; change to lower viscosity solvent
| |
Peak dispersion in injector valve
|
Decrease injector sample loop size; introduce air bubble in front and back of sample in loop
| |
Poor column efficiency
|
Use smaller-particle-diameter packing, lower-viscosity mobile phase, higher column temperature, or lower flow rate
| |
Retention time too long
|
Use gradient elution or stronger isocratic mobile phase
| |
Sampling rate of data system too low
|
Increase sampling frequency
| |
Slow detector time constant
|
Adjust time constant to match peak width
| |
Some peaks broad—late elution of analytes retained from previous injection
|
Flush column with strong solvent at end of run; end gradient at higher solvent concentration
| |
Ghost peaks
|
Contamination
|
Flush column to remove contamination; use HPLC-grade solvent
|
Elution of analytes retained from previous injection
|
Flush column with strong solvent at end of run; end gradient at higher solvent concentration
| |
Ion-pair chromatography—upset equilibrium
|
Prepare sample in mobile phase; reduce injection volume
| |
Oxidation of trifluoroacetic acid in peptide mapping
|
Prepare trifluoroacetic acid solutions fresh daily; use antioxidant
| |
Reversed-phase chromatography—contaminated water
|
Check suitability of water by running different amounts through column and measure peak height of interferences as function of enrichment time; clean water by running it through old reversed-phase column; use HPLC-grade water
| |
Unknown interferences in sample
|
Use sample cleanup or prefractionation before injection.
| |
Negative peaks
|
Refractive index detection—refractive index of solute less than that of mobile phase
|
Reverse polarity to make peak positive
|
UV-absorbance detection—absorbance of solute less than that of mobile phase
|
Use mobile phase with lower UV absorbance; if recycling solvent, stop recycling when recycled solvent affects detection
| |
Peak doubling
|
Blocked frit
|
Replace or clean frit; install 0.5 μm porosity in-line filter between pump and injector to eliminate mobile-phase contaminants or between injector and column to eliminate sample contaminants
|
Co-elution of interfering compound
|
Use sample cleanup or prefractionation; adjust selectivity by changing mobile or stationary phase
| |
Co-elution of interfering compound from previous injection
|
Flush column with strong solvent at end of ran; end gradient at higher solvent concentration
| |
Column overloaded
|
Use higher-capacity stationary phase; increase column diameter; decrease sample amount
| |
Column void or channelling
|
Replace column, or, if possible, open top end fitting and clean and fill void with glass beads or same column packing; repack column
| |
Injection solvent too strong
|
Use weaker injection solvent or stronger mobile phase
| |
Sample volume too large
|
Use injection volume equal to one-sixth of column volume when sample prepared in mobile phase for injection
| |
Un swept injector flow path
|
Replace injector rotor
| |
Peak
|
Channelling in column
|
Replace or repack column
|
fronting
|
Column overloaded
|
Use higher-capacity stationary phase; increase column diameter; decrease sample amount
|
Tailing peaks
|
Basic solutes—silanol interactions
|
Use competing base such as triethylamine; use a stronger mobile phase; use base-deactivated silica-based reversed-phase column; use polymeric column
|
Beginning of peak doubling
|
See peak doubling
| |
Chelating solutes—trace metals in base silica
|
Use high purity silica-based column with low trace-metal content; add EDTA or chelating compound to mobile phase; use polymeric column
| |
Silica-based column—degradation at high pH
|
Use polymeric, sterically protected, or high-coverage reversed-phase column; install silica gel saturator column between pump and injector
| |
Silica-based column—degradation at high temperature
|
Reduce temperature to less than 50 °C
| |
Silica-based column—silanol interactions
|
Decrease mobile-phase pH to suppress silanol ionisation; increase buffer concentration; deri-vatise solute to change polar interactions
| |
Un-swept dead volume
|
Minimise number of connections; ensure injector rotor seal is tight; ensure all compression fittings are correctly seated
| |
Void formation at head of column
|
Replace column, or, if possible, open top end fitting and clean and fill in void with glass beads or same column packing; rotate injection valve quickly; use injection valve with pressure bypass; avoid pressure shock
| |
Spikes
|
Bubbles in mobile phase
|
Degas mobile phase; use back-pressure restrictor at detector outlet; ensure that all fittings are tight
|
Column stored without caps
|
Store column tightly capped; flush reversed-phase columns with degassed methanol
|
APPLICATIONS OF HPLC
- Used in inorganic chemistry:
- Used in the separation of anions.
- Example: F−, Cl−, Br, HPO4−, NO2−, etc.
- Used in the separation of cations.
- Example: Mg+2, Pb+2, Cu+2, Mn+2, Cd+2, Zn+2.
- Used in forensic chemistry:
- Used in the detection of poisons and intoxicants.
|
Medicaments—hypnotics and related compounds.
|
|
Plant protection agents—cholinesterase agents.
|
Used in the analysis of addictive drugs.
Example: Cocain, heroin and opium alkaloids.
Used in the separation of alkaloids.
Example: Narcotine, papaverine, caffeine and strychnine.
Used in chemical criminology.
Example: Used in the identification of illicit drugs such as amphetamine blue or yellow.
Used in the investigation of documents.
Example: Identifes 25 blue ball-point pen inks.
Used in the analysis of explosives.
Example: Nitroglycerine (NG), diethylglycoldinitrate (DEGDB) and 3, 4-dinitrotoluene (DNT), etc.
Used in the separation of lipids.
Example: Used in triglyceride composition.
Used for the determination of cholesterol esters in blood.
Used in the separation of mono-, di- and tri-glycerides.
Used in separation of steroid hormones.
Example: Used in cortico steroids separation.
Used in oestrogen analysis for the monitoring of pregnancy.
Used in the separation of 17-ketosteroids.
Used in the separation of conjugated bile acids.
Used in nucleic acid research.
- Used in the studies of cyclic nucleotides.
- Used in the determination of composition of hydrolysates of nucleic acids.
- Used in the metabolic profiling
- Used in the separation and purification of nucleic acids.
Used in natural and synthetic pharmaceutical drugs analysis.
- Used in the separation of barbiturates, phenothiazines, benzodiazipines, rauwlfia alkaloids, etc.
- Used in the separation of antibiotics such as amoxicillin, ampicillin, pencillins, streptomycins, etc.
- Used in the separation of sulphonamides.
- Used in the analysis of calcium antagonists used in therapy of coronary diseases.
- Used in the separation of benzoic acid and salicylic acid in ointments.
- Used in the analysis of cardiac glycosides such as digitalis glycosides.
- Used in the separation of polyphenols such as flavanoids.
- Used in the identification of lignans, anthraquinone derivatives, saponins and terpenes, etc.
Comments
Visit here : Visit Elegencels Life Sciences
At Intech Analyticals, we specialize in providing advanced HPLC systems and solutions that ensure high performance, reliability, and efficiency. Our instruments are designed to meet the diverse needs of research and industrial laboratories, delivering consistent and accurate results for complex analyses. We’re proud to support innovation and excellence in chromatography applications.