Free pharmacy material


Electron Spin Resonance Spectroscopy
INTRODUCTION
The ESR technique was first developed by Zavoisky in 1944. The ESR is frequently called as electron paramagnetic resonance spectroscopy and electron magnetic resonance spectroscopy. This is an absorption spectroscopy in which radiation of microwave frequency is absorbed by paramagnetic substances. This method is mainly used to detect the compounds with the unpaired electrons. These measurements are mainly helpful in the study of the relationship between the energy differences and the absorption of the electromagnetic radiation. In this method, the spin is said to be intrinsic property of the electrons given by the quantum number ½.
The basic theory and instrumentation of ESR is similar to that of the nuclear magnetic spectroscopy, the only difference is the absence of chemical shift phenomenon in ESR.
Electron spin resonance (ESR) spectroscopy is a very powerful and sensitive method for the characterisation of the electronic structures of materials with unpaired electrons. The conditions required for the ESR spectroscopy are the following:
- Compounds containing the odd number of electrons.
- Compounds containing partly filled inner shells.
- Compounds containing the angular momentum of the electronic origin.
- Compounds containing the free radicals with unpaired electron.
The compounds containing the unpaired electrons with equal or opposite spin are said to be paramagnetic substances. They are of two types:
- Stable paramagnetic substances.
| |
|
NO
| |
|
O2
| |
|
NO2
|
Unstable paramagnetic substances.
Example: Free radicals
THEORY
The theory of the ESR is mainly based on the interaction of the magnetic momentum of an unpaired electron in a molecule ion with that of an applied magnetic field. This produces the differences in the energy levels which cause the absorption of the radiation in the microwave region. The unpaired electrons present in the ground state are excited to a higher energy state when placed in the magnetic field by absorbing the microwave radiation. Then these excited electrons spin change and returns to the ground state by the emission of the radiation. This returning of the electrons from the higher energy state to the ground state in the ESR is generally known as the relaxation process. This overall process is called as Zeeman effect.
An electron is a charged particle with angular momentum and hence possesses magnetic moment.
Bohr magneton
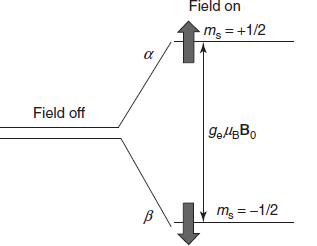
The two states are labelled by the projection of electron spin, Ms, on the direction of the magnetic field, Because the electron is a spin 1/2 particle, the parallel state is designed as
Ms = −1/2 and the antiparallel state is Ms = +1/2.
From quantum mechanics, we obtained the most basic equations of EPR
E = gμBBMs = ±1/2gμBB
ΔE = EH − EL = 1/2gμBB0 −(−1/2gμBB) = gμBB
where B is the external magnetic field; g is the gyromagnetic ratio; μB is the Bohr magneton; EH is the energy of the higher level; EL is the energy of the lower level.
Electrons excitation process in ESR spectroscopy
The different projections of the spin gain different energies are given by the following:
Ems = gμBB0μs
where B0 is the field strength of the external magnetic field. The SI units for magnetic field is tesla, T, or sometimes gauss (1 G = 0.0001 T) is used.
μs is the spin projection on the field (ms = ±1/2 for a free electron), μB is the Bohr magneton:
μB = eh/4pme = 9.27 × 10⁻²⁴ J/T
where e is the electron charge; me is the mass of the electron; h is the Planck's constant.
Then the g-value is measured by measuring the field separation between the centre of unknown spectrum and the reference substance. The standard substance commonly employed in the ESR is the DPPH. The g-value is nearly 2 that is 2.0036. The g-value is given by the following equation:
g = gs(1-ΔH/H)
where gs is the g-value of the standard substance; ΔH is the field separation between the sample and the standard; H is the resonance frequency.
The electron has nonzero orbital angular moment, L, and then g-value sometimes called as Lande's factor which is given by the following equation:
g = 1 + S(S + 1)−L(L + 1)+J(J + 1)2J(J +1)
The overall magnetic momentum, meff, is expressed by the angular momentum, J, and the g-value:
meff = gmB [J(J +1)] ½
For most of the organic radicals and radical ions, unpaired electrons have L close to 0 and the total electron angular momentum quantum number J is spin quantum number, S, and the g-values are close to 2.
Then the equation is written as the following:
EμJ = gJμBB0μJ
If L = 0, then J = S, and the equation defines the energies of all the possible projection of ms from −S to S −1, S.
The molecule contains nuclei with magnetic moments, such as protons, their interaction with external field and the electronic magnetic moment will change stationary energies of first equation. The nuclear angular momentum quantum number I determines the nuclear magnetic moment the same way as for the electron:
m = gNmN[I(I + 1)]1/2 = 5.051 × 10⁻²⁷J/T
With mN now being the nuclear Bohr magneton:
mN = eh/4pm0
The nuclear g factor, gN, is obtained from the structure of the nucleus. Interaction with external field splits the nuclear sublevels due to Zeeman interaction the same as for electron spin:
EmI = gNmNB0mI
where mI is one of the 2I + 1 projections of the nuclear spin.
Electron–nuclear interaction will depend on the projections of both, electron and nuclear spins:
Eelectron – nuclear = AmIms
where A is the coefficient also called as the hyperfine coupling constant which depends on the following:
- g-values for the electron and nucleus,
- distance between the electron and nucleus,
- dipole–dipole interaction.
In solutions, anisotropic part of this interaction averages because of the fast molecular rotation. The remaining isotropic part is given by the Fermi contact interaction in the form:
A = (8p/3)gN mN geμBγ
where r(0) = |y(0)|2 is the unpaired electron density at the nucleus.
For pure 1s electron on hydrogen atom, A equals h × 1420 MHz. Then the hyperfine constants are usually given in Gauss:
a = A/geμB
For example, hydrogen it corresponds to a = 508 G.
E = geμBms (B0 + SaimIi)
Consider the following conditions:
- The signs in front of ge and gN are different because of the opposite charges of the electron and the proton, causing a spin of the electron to be higher in energy than b, but bN spin of the proton to be higher in energy than aN.
- The magnetic field on the electron differs from the B0 by a integer times ai and the sign of this change is opposite for a and b electron spins.
Hydrogen atom example is given on the right. In EPR, allowed transitions correspond to the change of only ms:
Δms = plus or minus 1
ΔmI = 0
This indicates that electronic spin “flips” and nucleus is unchanged. Thus, in the figure on the right for hydrogen atom, only two transitions can be observed for a single resonant frequency hv.
These transitions are separated by the hyperfine constant a (508 G for hydrogen atom). If it contains more than one hydrogen, then each of hydrogen atom shows the change in magnetic field on the electron.
All combinations of the nuclear spin projections should be included but (EPR allowed) transitions only between sublevels with the same configurations of nuclear spins will be realised. For the case of four equivalent protons, a simple ladder propagation scheme illustrates how to construct the EPR spectrum. Each new step corresponds to one more proton added. In the first step, two lines appear corresponding to the two different orientations of mI = −1/2 and mI = +1/2.
Stick diagram for the radicals
In the second step, each line splits into two, corresponding to the two different orientations of mI = −1/2 and mI = +1/2 of the second proton. Since the two protons are equivalent, the splitting is the same on each step, resulting in three lines of 1:2:1 intensity ratio. For the four protons, there will be five lines with the 1:4:6:4:1 intensity ratio. Lines with the lengths of these ratio separated by appropriate constants are called to represent a stick diagram for the radical.
If the spin of the nucleus is greater than 1/2, as in the case of 14N (I = 1), it splits each of the electronic levels, a and b, into the 2I + 1 sublevels resulting in 2I + 1 observed lines of equal intensity. In most cases, one observes a combination of different nuclei with different constants which sometimes is not as easy to interpret.
Stick diagram
Example of a radical with two different groups of constants and different nuclei is shown on the right for a radical with one nitrogen and two equivalent hydrogen (e.g. NH2).
The magnitude of the hyperfine constants in a radical or radical ion reflects the extent of s character in its orbital.
McConnell showed that a part of the unpaired p-electron density is transferred through the C–H sigma bonding electrons to the H nucleus through exchange interactions. He provided a simple formula which links the aH on hydrogen with the unpaired electron spin density on the nearest carbon atom rp:
aH = −22.5yγp
The signal intensity in ESR depends on the absorption of the microwave radiation. This value will be the larger the greater the difference between populations of a and b electron spin states. This is given by the Boltzmann equation:
Boltzmann equation:
(na – nb)/nb = e−ΔE/KT –1 ∞gμBB0/KBT
where na and nb are the total number of the spins in the upper and lower energy state; KB is the Boltzmann constant (1.3806503 × 10⁻²³ J/K).
Thus the Boltzmann equation states that the sensitivity of the ESR method is enhanced by the decrease in the temperature and the increase in the applied magnetic field.
Line shape and kinetics
ESR signals for the TEMPO with different concentrations
EPR signal shape of a stable radical such as TEMPO varies with concentration.
It illustrates that the line widths of the resonant transitions are not infinitely small and can be altered by the environment.
At low concentrations, each line has a width because of the heterogeneous broadening, that is, unresolved structure of the small hyperfine constants and the homogeneous broadening, G0:
G0 = 1/geT2
This is caused by a limited lifetime T2 which is also called as spin–spin relaxation time of a radical at a particular spin state.
The constant ge is called the magnetogyric (or gyromagnetic) ratio and relates to Bohr's magneton, mB
ge = 4pμB/h = e/mec
The full half-width maximum, G, is 31/2/2 = 0.866 times greater than the measured distance between maximum and minimum of the experimentally detective derivative of absorption (G = 0.866 D).
This lifetime can be affected by the dipole–dipole (and exchange) interaction with other radical. Then another unpaired electron is at a distance, r, the magnitude of its field at the spin can take any value between ±2mB/r3, depending on orientation.
G = G0 + 2K [R]/3ge which is known as sloe exchange.
where K is the collision rate constant; [R] is the concentration of radicals.
With further increase of the radical concentration, the continuing broadening will be accompanied by a measurable decrease in separation between the peaks, ΔB:
(aN2 – ΔB)1/2 = 2K[R]/3ge
where aN is the hyperfine constant on nitrogen (separation between lines). After they coalesce, the overall width of now a single-line spectrum starts decreasing:
G = ge(aN2)/K[R]
RELAXATION AND SATURATION
In order to maintain steady-state conditions, the mechanism known as relaxation is applied. In this the electrons present in the higher energy state returns to the lower state by losing the energy. In the absence of the relaxation process, the saturation occurs where the continuous absorption of the energy by the electrons leads to equal population in both the states. This saturation condition is detected by the following conditions:
- No further absorption.
- No further resonance.
- No further signal.
- Broadening in signal.
The relaxation occurs by the two mechanisms:
- Spin–lattice relaxation: This is because of the interaction between an electron in an excited energetic level and surroundings.
- Spin–spin relaxation: This is because a spinning electron in upper level transfers energy to an electron in lower level that is electron exchanges spin state. In this, relaxation time decreases.
- Relaxation time should be sufficiently rapid to prevent saturation of upper energetic level at the same time sufficiently slow to yield narrow spectral peaks.
- Ratio of number of electrons in upper energy level to those in lower energy level is given by the Boltzmann law:
- n1/n2 = exp − ΔE/kT = exp − gμBB/kT
- Spin–spin splitting (hyperfine splitting): Magnetic resonance can occur without an external magnetic field from an interaction of the electron and the nuclear spin. Such resonance produces fine and hyperfine structure of atomic spectra.
The nuclei of atoms in a molecule or complex often have magnetic moment which produces a local magnetic field at the electron. The interaction between unpaired electrons and nuclei with nonzero nuclear spin is called the hyperfine interaction. This is mainly because of the interaction between the spinning electrons and the spinning adjacent nuclei. When the single electron reacts with the single nuclei then the number of splitting is equal to 2I + 1 or 2nI + 1,
where n is the number of the nuclei reacting with the electrons.
This leads to splitting of the ESR line and is known as hyperfine spectrum.
The spacing between the EPR spectral lines indicates the degree of interaction between the unpaired electron and the perturbing nuclei.
The hyperfine_coupling constant of a nucleus is directly related to the spectral line spacing.
Three common mechanisms by which electrons and nuclei interact are as follows:
- Fermi contact interaction: It is applied to the isotropic interactions which are independent of interaction between the sample and the magnetic field.
- Dipolar interaction: It is applied to the anisotropic interactions and depends on the interaction between the sample and the magnetic field.
- Spin polarisation: This is because of the interactions between an unpaired electron and a nuclear spin which is important for π-electron organic radicals such as the benzene radical anion.
The symbols “a” or “A” are used for isotropic hyperfine coupling constants while “B” is usually employed for anisotropic hyperfine coupling constants. The following are the some assumptions:
- For a radical having M equivalent nuclei, each with a spin of I, the number of EPR lines expected is 2MI + 1. As an example, the methyl radical, CH3, has three 1H nuclei each with I = 1/2, and so the number of lines expected is 2MI + 1 = 2(3)(1/2) + 1 = 4, which is as observed.
- For a radical having M1 equivalent nuclei, each with a spin of I1, and a group of M2 equivalent nuclei, each with a spin of I2, the number of lines expected is (2M1I1 + 1) (2m2I2 + 1). As an example, the methoxy methyl radical, H2C(OCH3), has two equivalent 1H nuclei each with I = 1/2 and three equivalent 1H nuclei each with I = 1/2, and so the number of lines expected is (2M1I1 + 1) (2M2I2 + 1) = [2(2)(1/2) + 1][2(3)(1/2) + 1] = [3][4] = 12, again as observed.
Resonance line width: Resonance line widths are defined in terms of the magnetic induction, B, and are measured along the x-axis of an EPR spectrum from a line's centre to a chosen reference point of the line. These defined widths are called half-widths and possess some advantages such as for asymmetric lines values of left and right half-width can be given.
The half-width ΔBh is the distance measured from the line's centre to the point in which absorption value has half of maximal absorption value in the centre of resonance line.
First inclination width ΔB1/2 is a distance from centre of the line to the point of maximal absorption curve inclination.
For symmetric lines,
Half-width ΔB1/2 = 2ΔBh
Full inclination width ΔBmax = 2ΔB1s
Energy levels of an unpaired electron that is coupled to a single magnetic nucleus with spin quantum number 2.
Diagrammatic presentation of hyperfine splitting due to one proton
INSTRUMENTATION
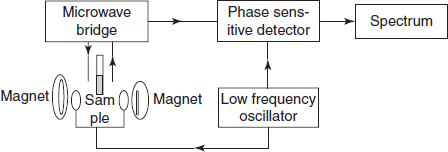
Schematic diagram for the ESR instrumentation
- An electromagnet: A linear magnetic field is generated by a powerful electromagnetic modulation coils located on the sides of the resonant cavity modulate the magnetic field.
- Source of microwave radiation: The usual source is a Klystron oscillator that normally operates at 9,500 MC/s. This produces the microwaves of 3 cm wavelength. It consists of the vacuum tube. The wavemeter or frequency meter measures the microwave frequency. Then the isolator isolates the narrow range of the microwaves.
- Sample cavity: The sample cavity or resonance cavity is placed between the two magnetic poles. Dual sample cavities are generally used. The cavities generally in use are cylindrical or rectangular type. The thickness of the sample cell is 0.25 mm and the sample capacity volume is 0.05 ml.
- Choice of solvent: ESR spectra can be obtained for gases, solutions, powders, single crystals and frozen solutions. Solvents of high dielectric constant such as alcohol and water should be avoided because they absorb microwave region. Solvents such as toluene, glycerol, nujol, iso-octane, triethanol amine are commonly employed as solvents.
- Crystal detector: The most commonly used detector is a silicon detector which acts as a microwave rectifer. This converts microwave power into a direct current output.
- Auto amplifier: After detection by the crystal detector, the signal undergoes narrow band amplification.
- Recorder or an oscilloscope: Finally the signal from detector and sweep unit is recorded by the oscilloscope or recorder.
DOUBLE RESONANCE SPECTROMETERS
- ENDOR (electron nuclear double resonance spectrometer): This technique is introduced by Feher which consists of the sample which is irradiated with a microwave frequency and a radio frequency. Sufficient microwave power is used to partially saturate one of the ESR lines so that the population of two electron spin states is nearly equalised. The radio frequency is used to induce transition with in nuclear states. At resonance, the population of the electron spin states is changed and ESR absorption is observed. Thus ESR lines are obtained which permit greater accuracy of measurement and greater resolution of hyperfine coupling constants.
- This technique is most suitable when there occurs broadening of normal electron resonance lines due to several nuclear energy levels and where quadrapole couplings are to be measured in a system with 1≥ 1.
- ELDOR (electron–electron double resonance): ELDOR is useful in simplifying complicated spectra with several hyperfine lines of different coupling constants and also used to study relaxation effects in free radicals. In ELDOR experiments, the effect of applying an intense second microwave field on the ESR spectrum is monitored. When two microwave fields are separated by an integral number of hyperfine intervals, the ESR signal detected is reduced in that intensity that permits the simplification of the couple spectra. Thus, the first derivative of the absorption curve is plotted against the strength of the magnetic field.
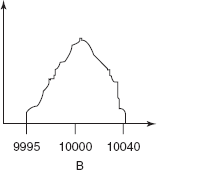
Absorption curve of a single maximum
Absorption curve with fine structure
First derivative curve of A
INTERPRETATION OF DERIVATIVE CURVES IN ESR
- Each negative slope in the derivative curve shows a peak or shoulder in the absorption spectrum.
- Every crossing of the derivative axis with negative slope indicates a true maximum where as a crossing with positive slope indicates a minimum.
- The total area covered by either the absorption or derivative is proportional to the number of unpaired electrons in the sample.
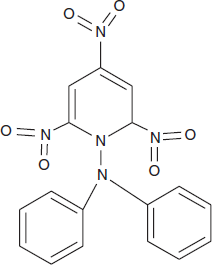
- The widely used standard is 1,1-di-phenyl-2-picryl hydrazyl (DPPH) free radical, which contains 1.53 × 10²¹ unpaired electrons per gram. It is chemically stable having splitting factor of g = 2.0036.
Structure of DPPH radical
APPLICATIONS
- Used in the study of free radicals.
- Used in the investigation of molecules in the triple state.
- Used in the study of inorganic compounds.
- Used in the structure elucidation of the organic.
- Used in the study of biological systems
- Used in the quantitative analysis.
- Used in the spin labelling of the protein structure by using the 2,2,6,6-tetra methyl piperidinol-n-oxyl.
- Used in the determination of the polarity of the substances.
- Used in the determination of the reaction velocities.
- Used in the determination of the reaction mechanisms.
- Used in the determination of the properties of the crude oil.
- Used in the determination of the radiation decay.
- Used in the detection of Mn+2 in the trace quantities.
- Used in the determination of the vanadium in the petroleum products.
- Used in the determination of the gadolinium ion.
- Used in the estimation of the poly nuclear hydrocarbons.
- Used in the study of the oxidation of the bacteria chlorophyll.
- Used in the study of the oxidative enzymes.
- Used in the tool for the molecular biotechnology.
- Used in the medical biotechnology.
- Used in investigate the DNA.
- Used in the analysis of the reverse transcriptase inhibition by polynucleotide.
- Used in the determination of the protein structure.
- Used in the determination of analysis of the enzymatic activity of nitric oxide synthetase.
- Used in the determination of the sugar residues.
- Used in the structural determination of the glycoproteins.
- – ESR is employed to analyse the process of sugar transport in bacteria.
- – ESR was applied to the analysis of the influence of diabetes on the properties of erythrocytes showing the decrease in erythrocyte deformability due to the non-enzymatic glycation of haemoglobin. Thus, structural investigation often reveals medical aspects.
- Used in the detection of the DNA binding drugs.
- Used in the determination effects of the chemotherapy.
- Used in the photosensitising action of the milk ingredient or riboflavine.
- Used in the determination of the water diffusion.
ADVANTAGES
- Simple
- Selective
- Specifcity
- High resolution
- Highly accurate
DISADVANTAGES
- Time consuming
- Not effective
REVIEW QUESTIONS
- What is ELDOR?
- What is ENDOR?
- What are the requirements to get ESR spectrum?
- What are the different components of ESR spectrometer?
- Define hyperfine splitting?
- What is gyrometric ratio?
- Name the standard used for the calibration of ESR spectra.
- What is Bohr magneton?
- Define the Boltzmann distribution law.
- What are the solvents used for ESR?
Comments