Free pharmacy material


Flame Photometry
INTRODUCTION
Flame photometry is defined as the measurement of intensity of the light emitted when any alkali or earth metal is introduced into the flame. Because of the emission of radiation, it is also known as flame emission spectroscopy. Based on the element present in the sample, it produces emission spectra and different colours to the flame.
Table shows the elements’ emission wavelength with different flame colours
PRINCIPLE AND THEORY
The compounds of the alkali and alkaline earth metals can be thermally dissociated in a flame and some of the atoms produced will be further excited to a higher energy level. When these atoms return to the ground state they emit radiation which lies mainly in the visible region of the spectrum. Here the main reason is after absorption of the thermal energy the atoms which are present in the ground state will be excited to higher energy levels but the excited state is not a stable one therefore the excited atoms loses energy and returns to the ground state by emission of radiation. Each element will emit radiation at a wavelength specific for that element. The table below gives details of the measurable atomic flame emissions of the alkali and alkaline earth metals in terms of the emission wavelength and the colour produced.
Element
|
Emission wavelength(nm)
|
Flame colour
|
Sodium (Na)
|
589
|
Yellow
|
Potassium (K)
|
766
|
Violet
|
Barium (Ba)
|
554
|
Lime green
|
Calcium (Ca)
|
622
|
Orange
|
Lithium (Li)
|
670
|
Red
|
The emitted radiation is calculated by the following equation:
E2 – E1 = hv
where E2 is the higher level energy; E1 is the lower level energy; h is Planck's constant; nv is the frequency of emitted radiation which is defined as
By substituting the ν value in the above equation
Therefore,
From the above equation, we can calculate the wavelength of the emitted radiation.
Excitation process diagram
In the case of the atoms, the population of any excited state relative to that of the ground state is given by the following equation which is known as Boltzmann equation.
where N* and N0 are the number of atoms in excited state and ground state, respectively; −ΔE is the energy difference between ground and excited state (in J); g* and g0 are the statistical factors that depend on the degeneracies of the levels involved; k is the Boltzmann constant (=1.28 × 10⁻²³ J k−); and T is the absolute temperature.
The intensity of the light emitted could be described by the Scheibe–Lomakin equation:
I = k×cn
where c is the concentration of the element; k is the constant of proportionality; n ~1 (at the linear part of the calibration curve), therefore, the intensity of emitted light is directly proportional to the concentration of the sample.
PRINCIPLE
A solution containing the relevant substance to be analysed is aspirated into the burner and dispersed into the flame as a fine spray. This process is called nebulisation. In the flame, the solvent evaporates first, leaving finely divided solid particles which move to hottest region of the flame where gaseous atoms and ions are produced. The atoms are excited by absorbing energy available from the flame. As the excited atoms return to a ground state of lower energy, radiation of wavelength, characteristic of the element, is emitted. The intensity of the emitted radiation is then measured, which can be related to the concentration of the element present, which forms the basis of quantitative analysis.
The following processes occur in the flame:
- Desolvation: The sample containing metal particles is dehydrated by the heat of the flame and the solvent is evaporated.
- Vapourisation: The heat of the flame vaporises the sample constituents. No chemical change takes place at this stage.
- Atomisation: At this stage, the metal ions that were in the solvent are reduced to metal atoms. For example, 2+ Mg (aq) + 2e− Mg (g). By the heat of the flame and by the action of the reducing gas (fuel), molecules and ions of the sample species are decomposed and reduced to give atoms.
- Excitation: The atoms at this stage are able to absorb energy from the heat of the flame. The amount of energy absorbed depends on the electrostatic forces of attraction between the negatively charged electrons and the positively charged nucleus. This in turn depends on the number of protons in the nucleus. As electrons absorb energy, they move to higher energy levels and they are in the excited state.
- Emission of radiation: Electrons in the excited state are very unstable and move back down to the ground state or a lower energy state quite quickly. As they do so, they emit the energy in the form of radiation of characteristic wavelength, which is measured by a detector. For some metals, this radiation corresponds to the wavelengths of light in the visible region of the electromagnetic spectrum and is observed as a characteristic colour of the flame. As electrons from different energy levels are able to emit light as they relax, the flame colour observed will be a mixture of all the different wavelengths emitted by the different electrons in the metal atom under investigation.
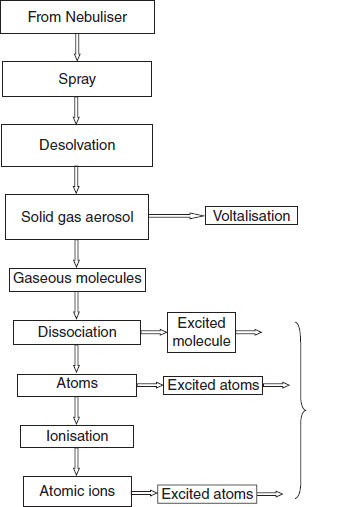
The five processes occurring in the flame can be summarised as follows:
- MX (soln.)
MX (solid)
- MX (solid)
MX (vap.)
- MX (vap.)
M + X
- M (ground state)
M* (excited state)
- M*
M + h−
Processes (ii) and (iii) may take place simultaneously and process (iii) may take place partially if the temperature of the flame is too low.
Flow chart of the steps involved in the flame photometry
INSTRUMENTATION FOR FLAME PHOTOMETRY
In flame photometry, the sample is introduced into a flame where it undergoes a number of processes leading to the formation of excited atomic species which emit the radiation. The radiation is then measured and suitably analysed. The instrument used for the purpose is called flame photometer and it consists of the following basic components:
Flame atomiser: It converts the sample to excited atomic species. It consists of the following:
- Nebulizer and mixing chamber: It is a means of transporting a homogeneous solution to the flame at a steady rate.
- Atomiser burner: Here the fuel and oxidant burn to give a flame that can be maintained in a constant form and at a constant temperature.
- Monochromator (or filter): It isolates the light of the wavelength to be measured from that of extraneous emissions.
- Detector: It helps in measuring the intensity of radiation emitted by the flame.
- Amplifier and readout device: It is used to amplify the signal and provides a suitable output.
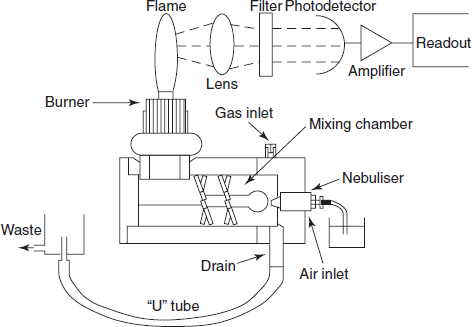
Schematic diagram of flame photometer
The role of atomizer is to generate the vapours of analyte which gets excited by the thermal energy of the flame and then emits characteristic radiation that is measured. The flame atomiser assembly consists of two components. The prior is a nebuliser where the sample in the form of a solution is drawn in and converted to a fine mist or an aerosol. It is then passed onto the second component that is the burner along with air or oxygen and a fuel gas. In the flame, a number of processes occur that convert the analyte to excited species.
Structure of Flames:
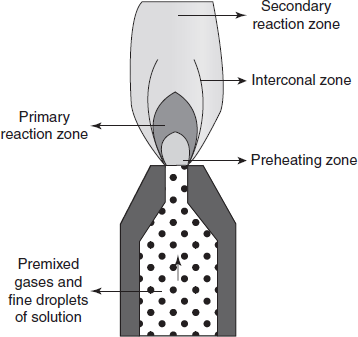
Flame characters diagram
As seen in the figure, the flame may be divided into the following regions or zones:
- Preheating zones.
- Primary reaction zone or inner zone.
- Internal zone.
- Secondary reaction zone.
The first or the innermost region of the flame is the preheating zone where the combustion mixture is heated to the ignition temperature by thermal conduction from the primary reaction zone.
The second zone is the primary reaction zone or inner zone. This zone is about 0.1 mm thick at atmospheric pressure and is visible by virtue of its blue green light ascribed to radicals C2 and CH. There is no thermodynamic equilibrium in this zone and the concentration of ions and free radicals is very high. This region is not used for flame photometry.
Immediately above the primary reaction zone lies the third or interconal zone or the reaction-free zonewhich can extend up to considerable height. The maximum temperature is achieved just above the tip of the inner zone. The higher temperature favours both production of free atoms and maximum excitation for atomic emission spectroscopy. Therefore, this zone is used for flame photometry.
The outermost fourth zone is the secondary reaction zone. Within this zone, the products of the combustion processes are burnt to stable molecular species by the surrounding air. The shape of an unmixed flame is generally different. The inner zone can still be recognised, but it is very vague and is thickened. A laminar flame makes a strong hissing noise which gets louder when a liquid is atomised into it. We shall now look into the reactions which are taking place when the element is placed in flame.
Nebuliser: It is a device used for introduction of sample into the flame. The process is called nebulisation and consists of thermal vaporisation and dissociation of aerosol particles at high temperatures producing small particle size with high residence time. A number of nebulisation methods are available. A few are listed below:
- Pneumatic nebulisation.
- Ultrasonic nebulisation.
- Electrothermal vaporisation.
- Hydride generation (used for certain elements only).
However, we would discuss about the pneumatic nebulisation only. It is the most commonly employed nebulisation method in flame photometers.
Pneumatic nebulizer: It is the most commonly used nebuliser for introducing aqueous/liquid samples. In this, the sample solution is fed or aspirated into the nebuliser which converts liquid into a fine mist, or aerosol which is then fed into the flame. The concentric pneumatic nebuliser consists of a fine capillary surrounded by concentric tube with a small orifice near one end of the capillary. The capillary is dipped into a solution of the analyte while the outer tube is connected to a high-pressure gas supply. The analyte is sucked into the capillary by the high-pressure gas stream flowing around the tip of the capillary using the Bernoulli effect. The process is called aspiration. The high velocity gas breaks up the liquid into various sized fine droplets. The other types of the pneumatic nebulisers also work on the same principle.
Atomiser burners: The sample is introduced in the form of a fine spray at a controlled rate into the flame of a burner with the help of nebuliser. In the burner, the analyte undergoes a number of processes as mentioned earlier. Two types of atomization burners have been used in flame photometry which are given below and explained in the following paragraphs.
- Pre-mix or Lundegarh burner.
- Total consumption burner.
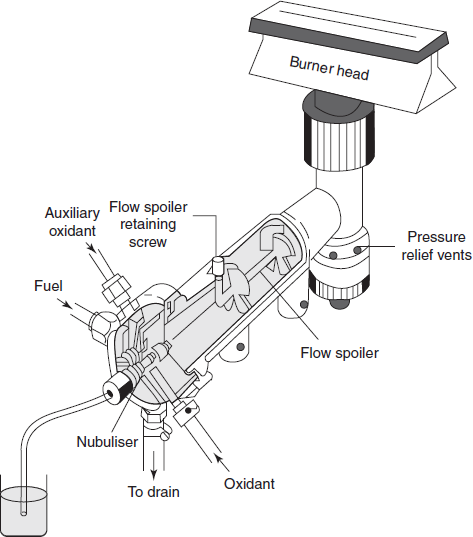
- Pre-mix or Lundegarh burner: In the pre-mix burner, fuel and oxidant are thoroughly mixed inside the burner housing before they leave the burner ports and enter the primary-combustion or inner zone of the flame. In this type of burner, the solution of the analyte is aspirated with the help of a nebuliser from the sample container into the mixing chamber in which the fuel gas is also introduced. The larger drops are stopped by baffles in the mixing chamber and are drained off. Pressure and density fluctuation of the aerosol due to atomisation are smoothened in the mixing chamber and mixture of aerosol, fuel gas and oxidant burns to yield stable noiseless flame. The solvent of the smaller droplets evaporates partly first in the mixing chamber, then in the conduit of the burner and finally in the flame. Only drops of a certain size can reach the burner and are completely burnt. Thus, the efficiency of the pre-mix burner is low and only 5% of the sample reaches the burner. The efficiency of this burner has been improved by putting an impact bead immediately after the nebuliser. The impact bead has the effect of breaking up large droplets as they come out from the nebuliser, thereby increasing the number of smaller droplets and the efficiency of nebulisation.
- Pre-mix burner schematic diagram
- The pre-mix burner has the following advantages:
- Less noise
- Easy to operate
- The pre-mix burner has the following disadvantages
- Loss of sensitivity
- Precautions should be taken.
- Total consumption burner: A total consumption burner combines the functions of the nebuliser and the burner. In this type of burner, the suction created by the compressed oxidant streaming pasts the inner capillary, introduces the sample directly into the flame even if it include suspended particles or large solvent droplets; hence the name “total consumption burner”
- Here the oxidant and fuel emerge from separate ports and are mixed above the burner orifices through their turbulent motion. The flame produced by such a burner is turbulent. As the aspirated, the sample solution as such is put into the flame, IUPAC recommends the term direct-injection burner in the place of total consumption burner. However, due to its prevalent use, the earlier term still continues to be in use.
- The total consumption burner has the following advantages:
- No loss in the fuel and oxidant.
- Eliminates the errors.
- Combustible sample, e.g., petroleum can be directly aspirated into the flame flame photometrywithout any danger of explosion. However, the total consumption burner suffers from the following disadvantages:
- Droplets of widely varying sizes are formed during aspiration.
- The flame is more strongly cooled by heavier load of the liquid.
- The burner tip can become incrusted with salts left after evaporation of solvent leading to a change in the aspiration rate of the solvent.
- The burners are very noisy both physically and electronically which lead to poor reproducibility of analytical results. For the above reasons, the total consumption burner is not much used except for explosive flames, e.g., hydrogen with other oxidants.
Monochromator: Filters are generally made from materials which are transparent in a small selective wavelength region. The filter chosen is one which has a wavelength range in which it is transparent to emission from the element of interest. In such a case, a condenser lens system is employed to collect the emitted light and sends the rays through the filter as an approximately collimated (parallel) beam to reach the detector. Filters have been designed for use in the determination of lithium, sodium, potassium, calcium and other elements.
The radiation source emits the polychromatic light which contains the wide range of frequencies. Monochromators are used for converting the polychromatic light into monochromatic light.
The most commonly used monochromators are prism and grating monochromators.
Prism monochromators: When polychromatic light passes through the prism, it is refracted. For IR, the prisms are made up of sodium chloride, potassium bromide, lithium fluoride and caesium bromide.
Grating monochromators: Grating is nothing but the lines made on the glass which is previously coated with aluminium. Rotation of these gratings converts the polychromatic light to monochromatic light more efficiently when compared to prism monochromators.
Detector: The function of a detector is to measure the intensity of radiation falling on it.
Photoemissive cells or photomultiplier tubes are commonly employed for this purpose.
These detectors are also used in UV–VIS spectrophotometers.
Amplifier and readout device: The output from the detector is suitably amplified and displayed on a readout device like a meter or a digital display. The sensitivity of the amplifier can be changed so as to be able to analyse samples of varying concentrations. Nowadays the instruments have microprocessor controlled electronics that provide outputs compatible with the printers and computers thereby minimising the possibility of operator error in transferring the data.
Table for the fuels and oxidants with flame temperatures
Fuel
|
Flame temperature
| |
Oxidant air (°C)
|
Oxygen (°C)
| |
Propane
|
2,100
|
2,800
|
Hydrogen
|
1,900
|
2,800
|
Acetylene
|
2,200
|
3,000
|
Fuel and oxidants: The following table shows the different combinations of fuel and oxidant to get desired flame temperature because the temperature of the flame is critical, which makes the necessity to select the combination of oxidant and fuel which gives the desired temperature.
APPLICATIONS OF FLAME PHOTOMETRY
- Qualitative applications:
- Used for the determination of alkali and the alkaline earth metals in samples which are easily prepared as aqueous solutions.
- Example: Sodium produces yellow flame.
- Nonradiating element such as carbon, hydrogen and halides cannot be detected.
- Quantitative applications:
- The concentration of various alkali and alkaline earth metals is important in determining the suitability of the soil for cultivation.
- Used for the determination of the concentration of sodium and potassium ions in body fluids since their ratio controls the action of muscles including the heart.
- Analysis of water from various sources is carried out to determine its suitability for drinking, washing, agricultural and industrial purposes.
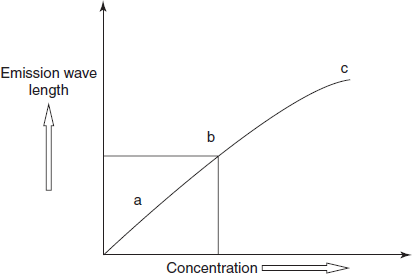
- The calibration curve is prepared by measuring the intensity of emission for a series of solutions of different concentrations prepared by using a standard solution and plotting a graph between emission intensity and concentration of the ionic species of the element of interest. The concentration of the element in the unknown sample can then be found out from the standard plot as is done in visible spectrophotometry.
Standard plot
The explanation for these regions in the above figure is given below:
- The region marked ‘a’ in the figure is depicted at very low concentration range. In this very low concentration range, emission falls below expected value due to ionisation as some atoms are converted to ions. For example, the ionisation of potassium is as given below:
- K
k+ + e−
- Such ionisation is, however, insignificant at higher concentration.
- The region marked ‘b’ is the linear region, which can be used for quantitative measurements.
- The region marked ‘c’ is depicted at a high concentration. In this concentration range, negative deviation is observed due to self-absorption. Photons emitted by the excited atoms are partly absorbed by ground state atoms in the flame.
If the samples contain high and variable concentrations of matrix materials, or when the samples contain solids, then effect on absorption is hard to duplicate. In such cases, the following two methods are employed:
- Standard addition method.
- Internal standard method.
Standard addition method: In this method, known amount of a standard solution is added to identical aliquots of the sample and the absorbance is measured. The first reading is the absorbance of sample alone and the second reading is absorbance of sample containing analyte plus, a known amount of analyte and so on. Similarly, in flame photometric determinations, increasing amounts of a standard solution of the salt of the element to be determined are added to a series of solutions of the sample. The intensity of emission for all these solutions is then measured. A curve of intensity versus concentration of the added element is obtained and extrapolated to zero value of intensity to give concentration of the element in the sample.
Internal standard method: In this method, a constant amount of another metal which is not present in the sample is added to both the unknown sample and a series of standard solutions of the element be determined. This is called internal standard, for example, lithium is added in the determination of sodium metal. Since both the element and the internal standard are in the same solution, the emission readings at the wavelengths of both the internal standard and the element to be enclosed are simultaneously determined. The intensity ratio for the two elements is then plotted against concentration of the standard solution. From the observed ratio for the sample, the concentration of the element in it can be determined.
INTERFERENCES IN QUANTITATIVE DETERMINATIONS
The interferences encountered can be classified as follows:
- Spectral interferences.
- Ionised interferences.
- Chemical interferences.
Spectral interferences: These interferences affect the spectral intensity or resolution. There are several types of spectral interferences which are explained below:
- The first type of interference arises when two elements exhibit spectra, which partially overlap, and both emit radiation at some particular wavelength. The detector cannot distinguish between the sources of radiation and records the total signal, thus resulting in incorrect answer. Such interferences are more common at high flame temperatures because numerous spectral lines are produced at high temperatures. For example, the Fe line at 324.73 nm overlaps with the Cu line at 324.75 nm. Such interference can be overcome either by taking measurements at an alternative wavelength which has no overlap, if available, or by removing the interfering element by extraction. Alternatively, one may make a calibration curve, which is prepared from a solution having similar quantities of the interfering element.
- The second type of spectral interference deals with spectral lines of two or more elements which are close but their spectra do not overlap. This type of interference becomes a problem when a filter is used as the device to isolate spectral lines. A filter may allow spectral lines separated by 5.0–10.0 nm to pass through, thus resulting in an error in the analysis. Such interferences can be reduced by increasing the resolution of the spectral isolation system. However, the interference cannot be eliminated entirely due to the finite width of the spectral isolation system and the finite slit width in such systems.
- A third type of spectral interference occurs due to the presence of continuous background which arises due to high concentration of salts in the sample, especially of alkali and alkaline earth metals. Some organic solvents also produce a continuous background. This type of interference can be corrected by using suitable scanning technique.
Ionisation interferences: In some cases, high temperature flame may cause ionisation of some of the metal atoms, for example, in the case of sodium, it can be given as follows:
Na  Na+ + e−
The Na+ ion possesses an emission spectrum of its own with frequencies which are different from those of atomic spectrum of the Na atom. This reduces the radiant power of atomic emission. This interference can be eliminated by adding a large quantity of a potassium salt to the standards as well as sample solutions. The addition of potassium salt suppresses the ionisation of sodium, as the potassium atom itself undergoes ionisation due to low ionisation energy. Thus, the sodium atom emission is enhanced. This type of interference is restricted to alkali metals.
Chemical interferences: The chemical interferences arise out of the reaction between different interferences and the analyte. These are of different types. Some of these are given below.
- Cation–anion interference: The presence of certain anions, such as oxalate, phosphate, sulphate and aluminate, in a solution may affect the intensity of radiation emitted by an element, resulting in serious analytical error. For example, calcium in the presence of phosphate ion forms a stable substance, as Ca3(PO4)2 which does not decompose easily, resulting in the production of lesser atoms. Thus, the calcium signal is depressed. Another similar example is that of determination of barium in the presence of sulphate forming insoluble BaSO4. This type of interference can be removed either by extraction of the anion or by using calibration curves prepared from standard solutions containing same concentrations of the anion as found in the sample.
- Cation–cation interference: In many cases, mutual interferences of cations have been observed, resulting in a reduced signal intensity of the element being determined. These interferences are neither spectral nor ionic in nature and the mechanism of such interferences is not well understood. Thus, for example, aluminium interferes with calcium and magnesium. Also, sodium and potassium show cation–cation interference on one another.
- Interference due to oxide formation: This type of interference arises due to the formation of stable metal oxide if oxygen is present in the flame, resulting in the reduced signal intensity. The alkaline earth metals are subject to this type of interference. This type of interference can be eliminated either by using very high flame temperature to dissociate the oxides or by using oxygen-deficient environment to produce excited atoms.
MERITS AND LIMITATIONS OF FLAME PHOTOMETRY
Merits
The sensitivities of the flame photometry for most alkali and alkaline earth metals lie in the ppm and sub-ppm range. Flame photometry is also successful in determining certain transition elements such as copper, iron and manganese.
LIMITATIONS
- As natural gas and air flame are employed for the excitation, the temperature is not high enough to excite transition metals, therefore the method is selective towards detection of alkali and alkaline earth metals.
- The low temperature renders this method susceptible to certain disadvantages, most of them related to interference and the stability of the flame and aspiration conditions. Fuel and oxidant flow rates and purity, aspiration rates, solution viscosity, affect these. It is therefore very important to measure the emission of the standard and unknown solutions under identical conditions.
- The relatively low energy available from the flame leads to relatively low intensity of the radiation from the metal atoms, particularly those that require large amount of energy to become excited.
- Only liquid samples can be used. In some cases, lengthy steps are necessary to prepare liquid samples.
ADVANTAGES
- It is a simple, relatively inexpensive, high sample throughput method used for clinical, biological, and environmental analysis.
REVIEW QUESTIONS
- What is the difference between the AES and flame emission spectroscopy?
- What is the principle involved in the flame emission spectroscopy?
- What are the parameters of the flame?
- What is the working principle of the pre-mix burner?
- What is the principle and working of the total consumption burner?
- What are different instrumental components of the flame spectrometer?
- What are limitations and advantages of the flame emission spectroscopy?
- What are the applications of the flame emission spectroscopy?
Comments