Free pharmacy material


Spectrophotometry-UV/Visible Spectroscopy
INTRODUCTION
Spectrophotometric techniques are mainly based on the measurement of interaction of electromagnetic radiation with the quantised matter at specific energy levels. In general terms, spectrophotometry is the measurement and interpretation of electromagnetic radiation absorbed when the molecules of a sample move from one energy state to another energy state (i.e., from ground state to excited state (or) exited state to ground state).
Electromagnetic waves are usually described in terms of (a) wavelength (λ), the distance between two successive peaks; (b) wave number (v), the number of waves per centimetre; frequency (v), the number of waves per second.
Waves Phenomenon
The arithmetic relationship of these three quantities is expressed by the following:
c = λv
The laws of quantum mechanics may be applied to photons to show that
E = hv
where E is the energy of the radiation; n is the frequency; and h is Planck's constant.
Combining these two equations
E = hc/λ
In the visible region, it is convenient to define wavelength in nanometres (nm) that is in units of 10−9 m, although other units may be encountered such as millimicron (μm) or Angstrom (Å).
1 nanometre = l nm = l mμ = 10 Å.
The visible spectrum is usually considered to be 380–770 nm and the ultraviolet region is normally defined as 200–380 nm.
Absorption of light in both ultraviolet and visible regions of the electromagnetic spectrum occurs when the light matches with the required spectrum to induce an electronic transition in the molecule and it is assisted with vibrational and rotational transitions.
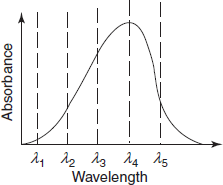
The diagram below shows a simple UV/visible absorption spectrum for buta-1,3-diene—a molecule which will be detailed later. Absorbance (on the vertical axis) is just a measure of the amount of light absorbed. The higher the value, the more particular the wavelength is being absorbed.
Absorption maxima diagram
It was invented in 1940 and commercialised in 1961.
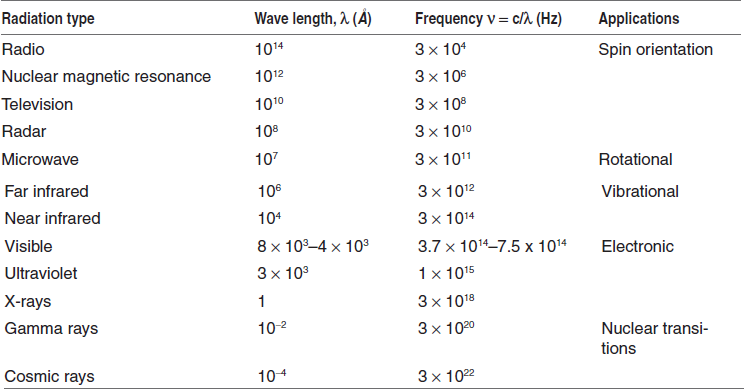
THE ELECTROMAGNETIC SPECTRUM
Table for the electromagnetic spectrums
THEORY
Electrons in the atom can be considered as occupying groups of roughly similar energy levels. In the more complicated molecular model, electrons associated with more than one nucleus, the so-called bonding electrons, are particularly susceptible to energy level transitions under the stimulus of appropriate radiation.
Absorption of Different Electromagnetic Radiations by Organic Molecules
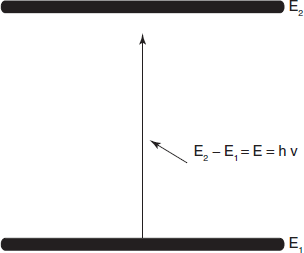
In absorption spectroscopy, although the mechanism of absorption of energy is different in the ultraviolet, infrared and nuclear magnetic resonance regions, the fundamental process is the absorption of a discrete amount of energy. The energy required for the transition from a state of lower energy (E1) to state of higher energy (E2) is exactly equivalent to the energy of electromagnetic radiation that causes transition.
Energy difference
Therefore E1 – E2 = E = hv = hc/λ, where E is the energy of electromagnetic radiation being absorbed; his universal Planck's constant, 6.624 × 10⁻²⁷ erg s and v is the frequency of incident light in cycles per second (cps or Hertz, Hz), c is the velocity of light 2.998 × 1010 cm s−1 and λ is the wavelength (cm).
Therefore, higher is the frequency, higher would be the energy and longer is the wavelength, lower would be the energy. As we move from cosmic radiations to ultraviolet region to infrared region and then radio frequencies, we are gradually moving to regions of lower energies.
A molecule can only absorb a particular frequency, if there exists within the molecule an energy transition of magnitude E = hv.
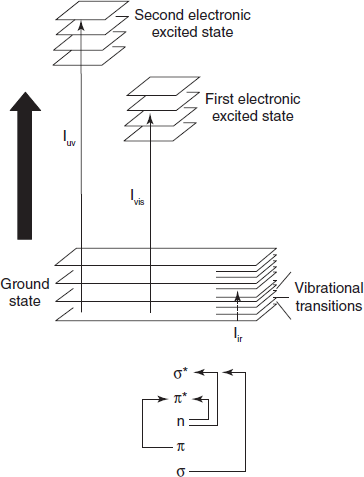
Electronic excited states diagram
Electronic Transitions
The absorption of UV or visible radiation corresponds to the excitation of outer electrons. There are three types of electronic transition which can be considered:
- Transitions involving p(π), s(σ), and n electrons.
- Transitions involving charge-transfer electrons.
- Transitions involving d and f electrons (not covered in this unit)
When an atom or molecule absorbs energy, electrons are promoted from their ground state to an excited state. In a molecule, the atoms can rotate and vibrate with respect to each other. These vibrations and rotations also have discrete energy levels, which can be considered as being packed on top of each electronic level.
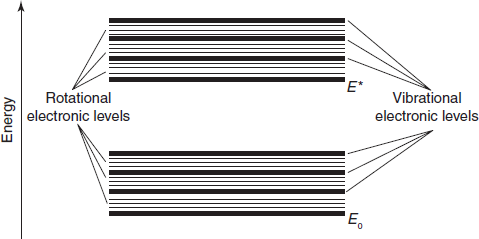
Electronic levels diagram
Absorbing Species Containing π, σ, and n Electrons
Absorption of ultraviolet and visible radiations in organic molecules is restricted to certain functional groups (chromophores) that contain valence electrons of low excitation energy. The spectrum of a molecule containing these chromophores is complex. This is because the superposition of rotational and vibrational transitions on the electronic transitions gives a combination of overlapping lines. This appears as a continuous absorption band.
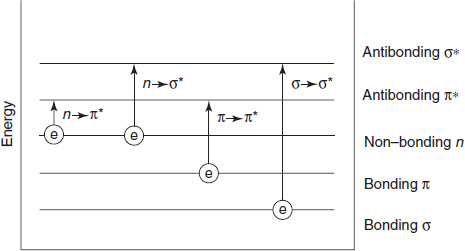
Possible electronic transitions of π, σ, and n electrons are the following:
Types of transitions diagram
σ  σ* Transitions: An electron in a bonding orbital s is excited to the corresponding antibonding orbital. The energy required is large. For example, methane (which has only C–H bonds, and can only undergo σ
  σ* transitions) shows an absorbance maximum at 125 nm. Absorption maxima due to σ
  σ* transitions are not seen in typical UV-visible spectra (200–700 nm).
n  σ* Transitions: Saturated compounds containing atoms with lone pairs (non-bonding electrons) are capable of n
  σ* transitions. These transitions usually need less energy than σ
  σ* transitions. They can be initiated by light whose wavelength is in the range 150–250 nm. The number of organic functional groups with n
  σ* peaks in the UV region is small.
n  π* and π
  π* Transitions: Most absorption spectroscopy of organic compounds is based on transitions of n or p electrons to the p* excited state. This is because the absorption peaks for these transitions fall in an experimentally convenient region of the spectrum (200–700 nm). These transitions need an unsaturated group in the molecule to provide the p electrons.
Molar absorbtivities from n  π* transitions are relatively low, and range from 10 to 100 L mol−1 cm−1. π
  π*transitions normally give molar absorbtivities between 1,000 and 10,000 L mol−1 cm−1.
The solvent in which the absorbing species is dissolved also has an effect on the spectrum of the species. Peaks resulting from n  π* transitions are shifted to shorter wavelengths (blue shift) with increasing solvent polarity. This arises from increased solvation of the lone pair, which lowers the energy of the n orbital. Often (but not always), the reverse (i.e. red shift) is seen for π
  π* transitions. This is caused by attractive polarisation forces between the solvent and the absorber, which lower the energy levels of both the excited and unexcited states. This effect is greater for the excited state, and so the energy difference between the excited and unexcited states is slightly reduced—resulting in a small red shift. This effect also influences n
  π* transitions but is overshadowed by the blue shift resulting from the solvation of lone pairs.
Charge-transfer Absorption
Many inorganic species show charge-transfer absorption and are called charge-transfer complexes. For a complex to demonstrate charge-transfer behaviour, one of its components must have electron donating properties and another component must have electrons absorbing properties. Absorption of radiation then involves the transfer of an electron from the donor to an orbital associated with the acceptor.
Molar absorptivities from charge-transfer absorption are large (greater that 10,000 L mol−1 cm−1).
Vibration and Rotation
The internal structure of a molecule may respond to radiant energy by more than just electronic transitions. In some molecules, the bonding electrons also have natural resonant frequencies that give rise to molecular vibration while others exhibit a phenomenon known as rotation. Because the differences in energy levels associated with vibration and rotation are much smaller than those involved in electronic transitions, excitation will occur at correspondingly longer wavelengths.
Different electronic transitions
Vibrational absorption is typically associated with the infrared region while the differences between the energy levels related to molecular rotation are so small that far infrared or even microwave wavelengths are effective. Because vibrational and rotational absorptions are primarily associated with spectral regions other than UV/visible, it is necessary here to note only the effect on electronic absorption spectra. The principal effect is of “peakbroadening”, i.e. the deviation of an observed absorption peak from the predicted shape.
For most absorbing species, especially in solution, absorption peaks do not appear as sharp lines at highly differentiated wavelengths, but rather as bands of absorption over a range of wavelengths. A principal reason is that an electronic transition is frequently accompanied by vibrational transitions between electronic levels (vibrational fine structure). In the same way, each vibrational level may have associated rotational levels so that an absorption spectrum due to an electronic transition may well be a complex structure, with contributing components from vibrational and rotational absorptions.
Generally, when light falls upon a homogenous medium, reduction of the intensity of the light may occur due to the following:
- A portion of the incident light is reflected.
- A portion is absorbed within the medium.
- Remaining is transmitted.
I0 = Ia + It + Ir
I0 is the intensity of incident light; Ia, t and r are the intensity of absorbed, transmitted and reflected light.
Generally reflection is not observed in the case of clear medium.
Flow of the radiation through the solution
The change of absorption of light with the thickness of the medium is given by Lambert and extended concepts are developed by Bouguer. Beer later applied that to different concentrations. The two separate laws governing absorption are known as Lambert's law and Beer's law and in combined, known as Beer–Lambert's law.
Beer's law: The intensity of a beam of monochromes in light decreases exponentially with increase in the concentration of absorbing species arithmetically. In quantitative analysis mainly concerned with solutions which Beer studied, the effect of concentration of the coloured constituent in solution upon the light transmission (or) absorption.
−dI/dc ∞ I
where I is the intensity of the incident light; dI is the decrease in the intensity of the incident light; dc is the decrease in the concentration.
dI/dc = KI (−K is proportionality constant)
dI/I = Kdc
On integration
– lnI – Kc + b(b = constant of integration) (1)
When the concentration is “0”, there is no absorbance, hence I = I0
−lnI0 = Kx0 +b
−lnI0 = b
By substituting the “b” value in Eq. (1)
−lnI = Kc −ln I0
lnI0 – lnI = Kc
lnI0/I = Kc (since log x − log y = log x/y)
I0/I =eKc
On inversing both sides
I/I0 = e−Kc
I = I0e−Kc Beer's law
Lambert's law: The rate of decrease in the intensity of the incident light with the thickness of the medium is directly proportional to the intensity of the incident light this is equivalent to stating that the intensity of emitted light decreased exponentially as the thickness of the absorbing medium increases arithmetically.
−dI/dt ∞ I
where dI is the decrease in the intensity of the incident light; dt is the decrease in the thickens of the medium.
Same as Beer's law we will get
I = I0e−Kt Lambert's law
By combining both Beer's and Lambert's equations, we get
I = I0e−kct
I = I010−kct (converting natural logarithm to base 10)
I/I0 = 10−kct
On inversing both sides
I0/I = 10−kct
log I0/I = Kct (taking log on both bides)
The quantity log I0/I is called as absorbance (A) and it is equal to the reciprocal of the common logarithm of transmittance (T)
A = log 1/I/I0
Therefore, A = log I0/I
T = log I/I0 = KCT
A = KCT
BEER–LAMBER'S LAW
When “C” is in moles/l, the constant is called molar absorptivity (or) molar extinction coefficient (ε):
A = ∊CT
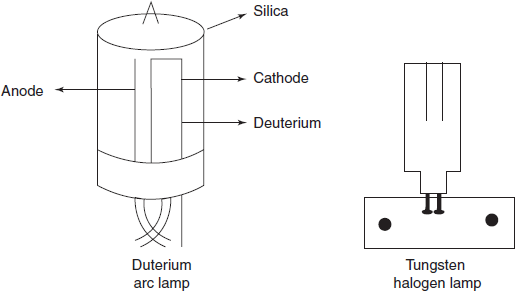
ε can also be written as
where  is the absorbance of 1% W/V solution using a path length of 1 cm.
Application of Beer's Law
Consider the case of two solutions of a coloured substance with concentrations C1 and C2 placed in an instrument in which the thickness of the layer can be altered and measured easily. When two layers have the same colour intensity
It1 = I0 × 10– ∊L = It2 = I0 × 10– ∊L2C2
where L1 and L2 are the lengths of columns of solutions
L1C1= L2C2
Hence it can be possible to investigate the validity of Beer's law by varying C1 and C2 and also for the determination of an unknown concentration.
Hence by plotting “A” as ordinate against concentration as abscissa, a straight line will be obtained and which will pass through the origin. This calibration line is used to determine the unknown concentration of solutions by measuring the absorbances.
Beer–Lambert's law plot
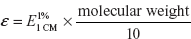
Deviation from Beer–Lambert's Law
Generally, positive deviation (upward carve) (or) negative deviation (downward curve) is observed in graphs of absorbance versus concentration (Beer–Lambert's Law plot) (or) of absorbance versus path length.
Beer–Lambert's Law plot
Positive deviation results when a small change in concentration produces a greater change in absorbance
Negative deviation results when a large change in concentration produces a smaller change in absorbance.
Several reasons for the observed deviation form Beer's law. They are as follows:
- Instrumental deviations such as stray light, improper slit width, fluctuation in single beam.
- Effect of stray light on Beer's law plots
- Chemical effects such as association, dissociation polymerisation, complex formation, etc. as a result of the variation in the concentration.
Examples:
- A solution of benzoic acid of high concentration in a sample solution has a lower pH and contains a higher proportion of unionised form than a solution of low concentration. The ionised and unionised forms of benzoic acid have different absorption characteristics.
- Hence increasing the concentration of benzoic acid gives max of 273 nm with positive deviation from Beer's law and lower absorption of 268 nm with negative deviation from Beer's Law.
- In unbuffered solution of potassium dichromate, the dissociation of the dichromate ions are observed by lowing the pH:
- Methylene blue at concentration of 105 M exists as a monomer and has max of 660 nm. But methylene blue at concentration above 10−4 M exists as dimer which has λmax of 600 nm.
- The Beer–Lambert's law does not hold when the solute forms complexes, the composition of which depends on the concentration.
- In complete reactions such as insufficient time for the completion of reaction also produces deviations from Beer's law.
- Example: Determination of iron using thioglycollic acid before completion of reaction.
INSTRUMENTATION
The different components are the following:
- Radiation source
- Monochromators
- Sample cells
- Detector
- Recorder (or) display
Flow chart of instrument of UV spectroscopy
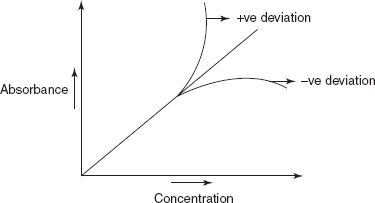
Radiation Source
- Tungsten–Halogen lamp: This lamp covers the wavelength ranging from the red end of the visible spectrum (750–800 nm) to the near ultraviolet (300–320 nm). The lamp is provided with a quartz outer sheath to permit the use of the ultraviolet part of the emission.
- Hydrogen (or) deuterium lamp: This is mainly used for the measurement of far ultraviolet (down to 200 nm). It consists of two electrodes dipped in a deuterium filled silica envelope.
Lamps Diagrams
Monochromator
The function of a monochromator is to produce a beam of monochromatic (single wavelength) radiation that can be selected from a wide range of wavelengths. The essential components are (1) entrance slit, (2) collimating device (to produce parallel light), (3) a wavelength selection or dispersing system, (4) a focusing lens or mirror and (5) an exit slit.
Two basic methods of wavelength selection may be noted: filters and a dispersing system (e.g., a prism or diffraction grating).
Filters: Filters of coloured glass or gelatine are the simplest form of selection, but they are severely limited in usefulness because they are restricted to the visible region and they have wide spectral band-widths. Typical bandwidths are rarely better than 30–40 nm.
Interference filters, essentially a substrate (glass normally, but may be silica) on which materials of different refractive indices have been deposited can be constructed with bandwidths of the order of 10 nm or less. However, the comparatively wide bandwidth – and therefore limited resolution – of filters, together with their inability to provide a continuous spectrum (except in special form such as wedge filters) make them inappropriate for use in routine laboratory spectrophotometry, in spite of low cost and technical simplicity.
Prisms: A prism of suitable material and geometry will provide a continuous spectrum in which the component wavelengths are separated in space. It is usual to improve the definition of the light between the source and the prism by using an entrance slit (to define the incident beam) and a collimator (to produce a parallel beam at the prism). After dispersion the spectrum is focused at the exit slit which may be scanned across the beam to isolate the required wavelength. In practice the prism is normally rotated to cause the spectrum to move across the exit slit. A typical prism monochromator is shown in below figure. Reflecting components, i.e. mirrors instead of lenses, are desirable in UV systems for both efficiency and cost considerations.
Simple condenser prism monochromator
Prism monochromators with bandwidths in the UV/visible of 1 nm or better are achieved without great difficulty and so performance is greatly improved compared with filter-based designs. However, there are drawbacks associated when using prisms: (1) their non-linear dispersion, (2) the temperature-related characteristics of the commonly used prism materials and (3) the complicated prism drive mechanism necessary to provide a convenient wavelength control and readout.
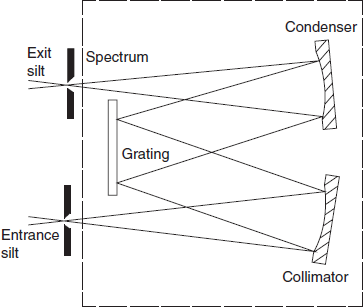
Diffraction gratings: Gratings provide an alternative means of producing monochromatic light. A diffraction grating consists of a series of parallel grooves (lines) on a reflecting surface that is produced by taking a replica from a master carefully prepared using a machine or, increasingly, from one which is holographically generated. The grooves can be considered as separate mirrors from which the reflected light interacts with light reflected from neighbouring grooves to produce interference, and so to select preferentially the wavelength that is reflected when the angle of the grating to the incident beam is changed. Among the advantages that gratings offer (compared to prisms) are better resolution, linear dispersion and therefore constant bandwidth and simpler mechanical design for wavelength selection.
Gratings monochromator diagram
When parallel radiation illuminates a reflecting diffraction grating, the multiple reflections from the mirror grooves will overlap and interfere with each other. If the reflected waves are in phase, interference is said to be constructive and the reflected light is not affected. If the reflected waves are out of phase, there is destructive interference and light of the wavelength at which such interference occurs will not be propagated.
The relationship that determines the wavelength of the reflected light is expressed by the following:
nλ = 2d sin θ
where n is the order (see below); d is the separation of the reflecting surfaces (or lines) and θ is the angle of incidence of the radiation. Rotating the grating in the light beam changes θ and so selects the wavelength to be reflected.
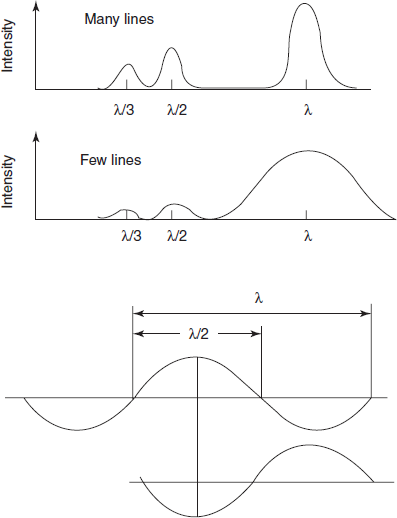
Two additional characteristics of gratings may be noted:
- If wavelength λ is reflected for a given angle q, then λ/2, λ/3 and so on are also reflected at that angle. These overlapping spectra, known as second and third orders, etc., can be removed with filters or with a pre-monochromator. Careful selection of the blaze angle (the angle at which the groove is cut) will peak the energy at the wavelength of the blaze, typically 250 nm for instruments of the kind under discussion.
- Both the energy and the resolution of a grating are directly proportional to the number of lines. For maximum efficiency, the line separation should be as close as possible to one wavelength, and for UV/visible gratings, the line density is typically 1200 per mm.
Efficiency of the gratings diagram
Gratings have the following advantages over prisms:
- Better resolution and energy transfer.
- Linear dispersion and therefore constant bandwidth.
- Less complicated wavelength drive mechanism is required.
- Stray light is limited to imperfections at the grating surface.
Optical Geometry
As all absorption measurements are ratio dependent (I/I0), it is necessary to record a reference solution before bringing the sample under test into the light path. These measurements are done using a cuvette (matched, if possible, to that containing the test sample) in the light path filled with the appropriate solvent. The reference intensity (I0) varies with wavelength in a complicated multi-function way (due mainly to source energy, monochromator transmission, slit width and detector response), so it is essential, when measuring absorption, to re-measure the reference for each discrete wavelength at which measurement is to be made. All modern instruments are microprocessor based and have the facility to store a baseline, that is, 100% T or 0 A set at each wavelength in the range, overcoming this requirement. This has allowed single beam spectrophotometers to compete on performance with the more expensive double beam instruments.
Additional advantages of microprocessor handling of the detector output are the ability to introduce component factors (e.g., concentration or molar absorption data) and to present results in alternative formats without additional manual calculation. An important consideration in some laboratories is the ability to interface with personal computers, so that results can be incorporated into a laboratory information management system or transferred to disk for archiving or data manipulation purposes.
Single-beam optics: The development of microprocessor has made it possible to achieve excellent results using a single-beam configuration when compared to a double-beam configuration; these results in greater optical and mechanical simplicity. The process of comparison between reference and sample cells can be achieved with single-beam instrumentation by feeding the post-detector signal to a microprocessor which stores the reference data for subtraction from the sample signal prior to printing or displaying the reference corrected result (the baseline). Signal levels can be compared between different samples at one wavelength, at a series of predetermined wavelengths or, if wavelength drive is provided, a complete absorption spectrum can be obtained.
Split (reference) beam optics: With the introduction of xenon flash lamps into spectrophotometers, the split beam configuration has become necessary; this is because, the high-intensity flashes from the xenon pulse lamp are not always of equal magnitude. Thus approximately 70% of the energy from the monochromator is passed through the sample, with the rest going to a separate feedback detector, enabling a means of taking into account drops/gains in energy via a feedback gain loop in the detector electronics. This stabilises the system, and there are no large extra cost elements involved.
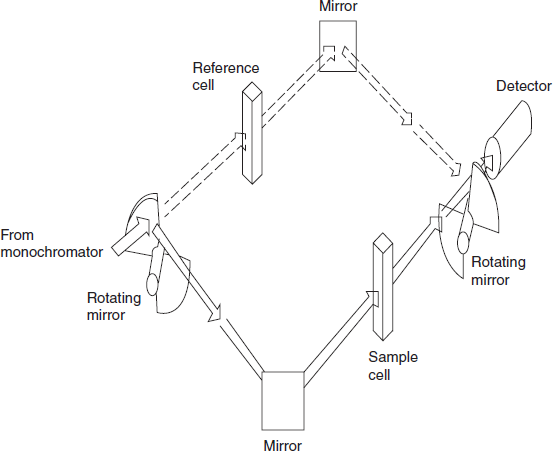
Double-beam optics: Traditionally, the preferred technique was a double-beam geometry in the sample handling area. Double-beam operation is achieved by a time-sharing system in which the light path is directed (by rotating sectional mirror or similar device) alternately through the sample and the reference cell. The wavelength-dependent functions of the instrument are significantly reduced to give much improved operating characteristics by a feedback system in the reference channel that adjusts the detector gain to compensate for source and detector variations. To make full use of the potential of double-beam operation, it is usual to add wavelength scanning and some form of output recording. UV/visible spectrophotometers of this type will, after initiation, produce automatically an absorption spectrum of the kind shown in the below figure.
Diode array optics: A fourth optical configuration is the diode array; here, light is monochromated after passing through the sample, which means that no sample compartment lid is necessary. The other major difference is that the dispersive element (grating) is fixed and does not move, as in more conventional systems.
Arrangement of the instrumental components diagram
Sample Cells
Sample presented for spectrophotometric analysis may be in the solid, liquid (or) in the gaseous state, the material that contains the sample should be ideally transparent at the wavelength of measurement.
Sample cells diagram
For the analysis of liquids and gases in UV/visible region above 320 nm, cells constructed with optically flat fused glass may be used for measurements and below 320 nm requires the use of more expensive fused silica cells which are transparent to below 180 nm. The standard path lengths of cells are in the range of 10 mn and also 1–50 nm cells available for special applications.
Detectors
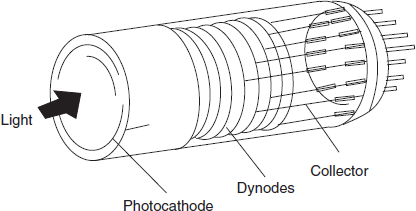
Most commonly used detector in the UV/visible spectrophotometers are photomultiplier tubes. In order to obtain greater sensitivity to very weak light intensities, multiplication of the initial photoelectrons by secondary emission is employed. Several anodes at a gradually increasing potential are used in one bulb.
PMT detector diagram
Electrons from the photocathode are attracted to anode 1 and liberate more electrons which travel to anode 2 and continues to the last anode and results in final current of 106–108 times greater than that of primary current.
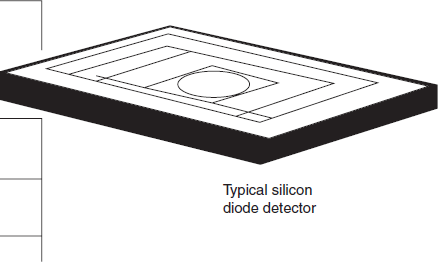
Silicon diode: Silicon diode detectors have good performance characteristics when (when the device is integrated with an operational amplifier) compared with those of a photomultiplier, but having a wider wavelength range but less sensitivity. They are mechanically robust (being solid-state devices), and electronic benefits include reduced power supply and control circuit requirements.
Recorders
The primary function of a spectrophotometer ends with the provision of a signal (normally an electrical voltage) that is proportional to the absorption by a sample at a given wavelength. The signal handling and measuring systems can be as simple as an amplifier and a meter or as elaborate as a personal computer and printer, depending on the application. In the simplest form, a meter will serve either to indicate the absolute value of the output signal, or in some instances, the null point in a back-off circuit. Digital readouts (LED or LCD) are favoured for clarity and lack of ambiguity and it may be linked to a microprocessor such that readout is in any preferred terms, for example, directly in concentration units. Chart (or other) recorders can be used with instruments equipped with wavelength scanning systems to provide directly an absorption spectrum. They are also useful in the study of reaction rates where the requirement may be to plot absorption against time at a fixed wavelength.
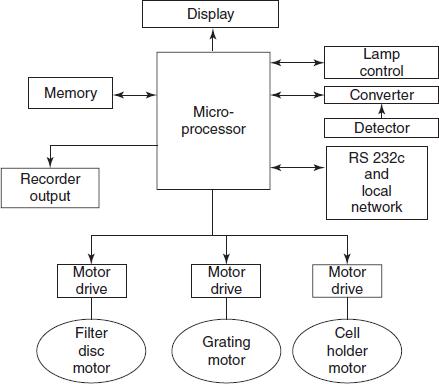
A block diagram of the post-detector electronic handling and of the integrated output and drive systems of a modern sophisticated single-beam spectrophotometer, all controlled via a single microprocessor, is shown the below figure. Once the operator has defined the parameters (e.g., wavelength, output mode and relevant computing factors) the system will ensure the correct and optimum combination of all the variables available. Selection of source and detector are automatically determined, any filters (e.g. order suppressing filters) or other components will be introduced into the optical train at appropriate points and sample and reference cells are correctly managed in the sample area. Output in the required terms (transmittance, absorbance, concentration, etc.) will be presented and the relevant sample will be identified. Secondary routines such as wavelength calibration and other self-tests may be available on demand and interfacing with external computers or other instrumentation – e.g., automatic sampling devices – is easy.
Block diagram of a microprocessor controlled spectrophotometer
SPECTROPHOTOMETERS
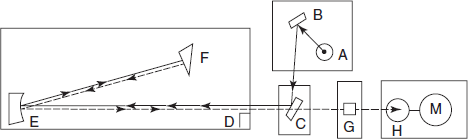
Single-beam spectrophotometers: An image of light source “A” is focused by the condition mirror “B” and the diagonal mirror “C” on the entrance slit at “D”. Light falling on the collimation mirror “E” is rendered parallel and reflected to quartz prism “F”. The back surface of the first surface is reflected back through the prism via the absorption cell “G” to the photo cells (H): the photocell response is amplified and recorded on “M”.
Double-beam spectrophotometers: Most UV/visible double-beam spectrophotometers over the range between about 200 and 800 nm by a continuous automatic scanning.
In this type, the monochromatic light is split by a rapidly rotating beam chopper into two beams which are directed to sample and reference.
THE ORIGINS OF ABSORPTION SPECTRA
The absorption of radiation is due to fact that molecules contain electrons which can be raised to higher energy levels by absorbing the energy. Electrons in a molecule can be classified as follows:
- σ-Electrons: These electrons are present in lightly bound single covalent bond and radiation of high energy is required to excite them.
- Π-Electrons: These are in double (or) triple bonds which can be excited relatively easily.
- n-Electrons: These are electrons attached to chlorine, oxygen (or) nitrogen as lone pairs. These non-bonding electrons can be excited at a lower energy than “a” electrons
Electronic transition in organic compounds
*Excited orbital.
SOLVENT EFFECTS
Highly pure, non-polar solvents such as saturated hydrocarbons do not interact with solute molecules either in the ground or excited state and the absorption spectrum of a compound in these solvents is similar to the one in a pure gaseous state. However, polar solvents such as water, alcohols, may stabilise or destabilise the molecular orbitals of a molecule either in the ground state or in the excited state and the spectrum of a compound in these solvents may significantly vary from the one recorded in a hydrocarbon solvent.
- π
π* Transitions: In the case of π
π* transitions, the excited states are more polar than the ground state and the dipole–dipole interactions with solvent molecules lower the energy of the excited state more than that of the ground state. Therefore, a polar solvent decreases the energy of π
π* transition and absorption maximum appears ~10–20 nm red shifted when going from hexane to ethanol solvent.
- n
π* Transitions: In the case of n
π* transitions, the polar solvents form hydrogen bonds with the ground state of polar molecules more readily than with their excited states. Therefore, in polar solvents, the energies of electronic transitions are increased.
SELECTION OF SOLVENTS
Solvents have important effects on the determination by UV/visible spectrophotomerty. They should possess the following:
- It must be a good solvent.
- It should not interfere with the solute.
- It should not show significant absorption.
Examples of Solvents
Solvent
|
λ max (nm)
|
Water
|
190
|
Hexane
|
199
|
Ethemol
|
207
|
Methanol
|
210
|
Cyclohexane
|
212
|
Chloroform
|
247
|
Carbon tetra chloride
|
257
|
Benzene
|
280
|
Some Important Terms and Definitions
Chromophore: The energy of radiation being absorbed during excitation of electrons from ground state to excited state primarily depends on the nuclei that hold the electrons together in a bond. The group of atoms containing electrons responsible for the absorption is called chromophore. Most of the simple un-conjugated chromophore gives rise to high-energy transitions of little use.
Example: σ-bonded electrons (C-C, C-H, etc.) σ  σ* transition shows λ max of ~150 nm.
Lone pair of electrons (–O –, -N-, -S-) n  σ* transition shows λ max of ~ 190 nm.
Auxochrome: The substituents that do not absorb ultraviolet radiations but their presence shifts the absorption maximum to longer wavelength are called auxochromes. The substituents such as methyl, hydroxyl, alkoxy, halogen, amino group, etc., are some examples of auxochromes.
Bathochromic shift or red shift: A shift of an absorption maximum towards longer wavelength or lower energy.
Hypsochromic shift or blue shift: A shift of an absorption maximum towards shorter wavelength or higher energy.
Hypochromic effect: An effect that results in decreased absorption intensity.
Hyperchromic effect: An effect that results in increased absorption intensity.
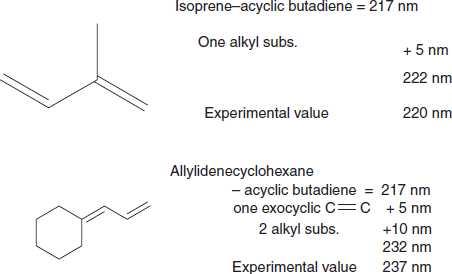
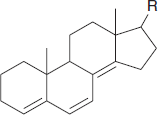
Woodward-Fieser's Rules
Woodward's and Fieser's performed extensive studies on terpene and steroidal alkenes and noted similar substituents and structural features would predictably lead to an empirical prediction of the wavelength for the lowest energy π  π* electronic transition.
This work was distilled by Scott in 1964 into an extensive treatise on the Woodward–Fieser rules for the determination of structure.
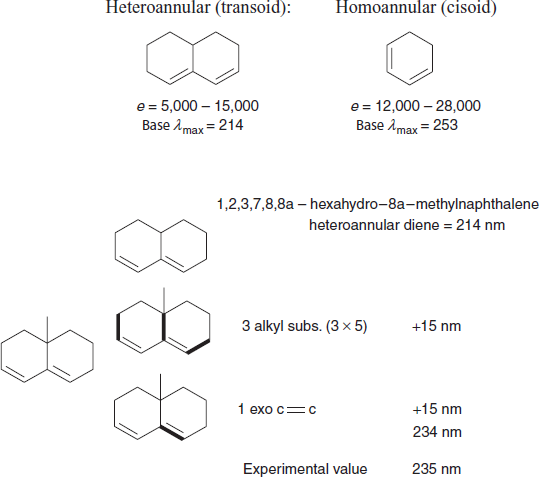
Dienes
Example:
Cyclic dienes: There are two major types of cyclic dienes, with two different base values.
Three common errors:
This compound has three exocyclic double bonds; the indicated bond is exocyclic to two rings.
This is not a heteroannular diene; we should use the base value for an acyclic diene.
Likewise, this is not a homoannular diene; we should use the base value for an acyclic diene.
Aromatic Compounds
Substitution, auxochromic, conjugation and solvent effects can cause shifts in wavelength and intensity of aromatic systems similar to dienes and enones.
However, these shifts are difficult to predict—the formulation of empirical rules is not efficient for most of the part (there are more exceptions than rules).
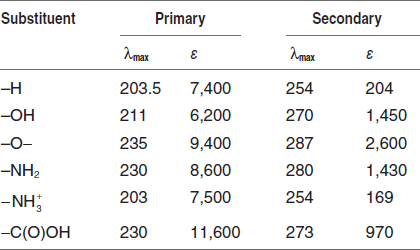
There are some general qualitative observations that can be made by classifying substituent groups:
- Substituents with unshared electrons:
- If the group attached to the ring bears n electrons, they can induce a shift in the primary and secondary absorption bands.
- Non-bonding electrons extend the p-system through resonance—lowering the energy of transition π
π*. More available n-pairs of electrons give greater shifts.
- pH can change the nature of the substituent group. Deprotonation of oxygen gives more available n-pairs, lowering transition energy protonation of nitrogen eliminates the n-pair, raising transition energy.
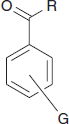
- Substituents capable of p-conjugation:
- When the substituent is a p-chromophore, it can interact with the benzene p-system.
- With benzoic acids, this causes an appreciable shift in the primary and secondary bands.
- For the benzoate ion, the effect of extra n-electrons from the anion reduces the effect slightly.
- Electron-donating and electron-withdrawing effects:
- No matter what electronic influence a group exerts, the presence shifts the primary absorption band to longer l.
- Electron-withdrawing groups exert no influence on the position of the secondary absorption band.
- Electron-donating groups increase the l and e of the secondary absorption band.
- Di-substituted and multiple group effects:
- With di-substituted aromatics, it is necessary to consider both groups.
- If both groups are electron donating or withdrawing, the effect is similar to the effect of the stronger of the two groups as if it were a mono-substituted ring.
- If one group is electron withdrawing and one group electron donating and they are para-to one another, then the magnitude of the shift is greater than the sum of both the group effects.
- Consider p-nitroaniline:


– If the two electronically dissimilar groups are ortho or meta- to one another, then the effect is usually the sum of the two individual effects (meta-resonance ortho-steric bind).
– For the case of substituted benzoyl derivatives, an empirical correlation of structure with observed λmax has been developed. This is slightly less accurate than the Woodward–Fieser rules, but can usually predict within an error of 5 nm.
Methods Available for Assays of Samples
- Standard absorptivity value method: The use of standard “A” values (or) “E” values avoids the preparation of standard solution of reference substance in order to determine its absorptivity.
- Example: Calculation of the concentration of methylstearate unknown absorbance is 0.890 at 241 nm. The STD value is 540 at 241 nm:
- A = A1 cm1% bc
- 0.890 = 540 × 1 × C += 0.00165 g/100 ml
- Calibration graph method: In this, the absorbances of a number of substance are measured and a calibration graph is plotted from the graph to obtain the regression line.
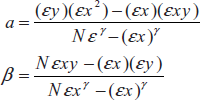
- y = α + βx can be estimated by the method of least squares.
- where y = absorbance value; x = concentration; N = number of pairs of values.
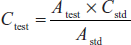
- Single (or) double point method: The single point precedence involves the measurement of the absorbance of a sample salutation of a slandered solution of the reference substance.
- where Ctest and Cstd are concentrations of sample and standard solutions, respectively. Atest and Astdare absorbance's of the sample and standard solutions.
- Two-point Backing standardisation is required to determine that the concentration of sample is greater than that of the sample while the other standard. solution has a lower concentration than the sample. The concentration of the sample solution is given as
- Std1 and Std2 refer to more concentrated standard and concentrated standard respectively.
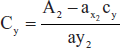
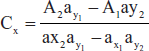
- Simultaneous equations method: If a sample contains two absorbing drugs (X and Y) each absorbs at the X max X2, then it is possible to determine both drugs by Vierodt's method.
- The information required as follows:
- The absorptivities of X at λ1 are ax1 and ax2 respectively.
- The absorptivities of Y at λ2 are ay1 and ay2 respectively.
- Cx and Cy are the concentrations x and y
- At λ1 A1 = ax1 bcx + ay1 bcy
- At λ2 A2 = ax2 bcx + ay2 bcy
- in cm cells b = 1
- substituting the Cy value
- and
- And this equation is concised and
- The absorbances of the liquid sample A1 and A2, respectively.
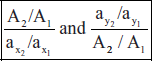
- Absorbance ratio method: The absorbance ratio method is a modification of the simultaneous equation procedure. It depends on the property that for a substance which obeys Beer's law at all wavelengths, the ratio of absorbances at any two wavelengths is a constant value.
- For example, two different dilutions of the same substance give the same absorbance ratio A1/A2 is 2. This ratio is referred a Q value.
- Geometric correction method: A number of mathematical correction procedures have been developed which reduce (or) eliminate the background irrelevant absorption that may be present in the sample of biological origin. The simplest of these procedures is the three-point geometric procedure which may be applied on it and the irrelevant absorption is linear at the three wavelengths selected.
- Difference spectrophotometry: The essential feature of a difference spectrophotometry is that the measured value is the difference absorbance (A) between two equivocal solutions of the analyte in different chemical forms which exhibit different spectral characteristics.
- The most commonly employed technique is the adjustment of P by means of acid, alkali (or) H buffer. The wavelength at equal absorptive of the two species is called isopiestic points.
- A = Aalkali −Aacid
- Also obtained by the derived equation:
- A = abc
- where a is the difference absorptivity; b is the path length; C is the concentration.
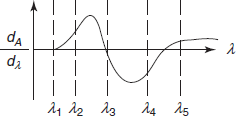
- Derivative spectrophotometric method: Derivative spectrophotometry involves the conversion of a normal spectrum to its first, second (or) higher derivative spectrum.
- The normal absorption spectrum is referred as zeroth order (or) D0 spectrum.
- The first derivative spectrum (D1) is a plot between the rate of change of absorbance with wavelength and wavelength.
- The second derivative (D2) spectrum is a plot between the curvature of the D0 spectrum and wavelength.
- A derivative spectrum therefore shows better resolution of overlapping bands of the fundamental spectrum and permits the accurate determination of the X max of the individual bands.


- Chemical derivatisation methods: These methods are based on the conversion of the analyte by a chemical reagent to a derivative that has different spectral properties. The following are the mainly used methods for chemical derivatisation.
- Diazotisation: The amine is first diazotised with a aqueous solution of HN02 (by the reaction of HCL and NANO2) at 0–5 °C.
- Ar – NH2 + HNO2 Ar – N+ = N + 2H2O
- The colourless diazonium salt is very reactive when treated with a suitable coupling agent.
- Example: Phenol (or) aromatic amine undergoes an electrophillic substitution and produces an azoderivative.
- Ar − N+ ≡ N + Ar′ − H
Ar − N = N − Ar + H+
- The azo derivatives are coloured and consequently have an absorption maximum in the visible region. Examples of coupling reagents are Borltan and Marshall's reagent which absorbs at 545 nm.
- Condensation reactions: These reactions involve the nuclophilhic attack by the amine on carbonyl carbon with elimination of H2O
- Acid dye method: The addition of an amine in its ionised form to form an ionised audic dye.
- Example: Methyl orange (or) bromocresol purple yields a salt that will be extracted into organic solvents such as CHCL3 or dicholoromethane. The absorbance is measured against reagent blank.

GOOD OPERATING PRACTICE
The good operating procedure is mainly required for the spectrophotometric assays. The materials, equipment and the sample cuvette should be properly cleaned. The reference and sample cuvette should be identical in all parameters, that is, in volume, shape and optical parameters. The cells should have the transmission characteristics matched to 1% or better over a defined wavelength range.
Preferred Absorption Range
The spectrophotometer should be able to measure the wide absorption range by avoiding the noise in the detector. The error of the detectors should be in the range of 0.8–1.5 A. Spectrophotometers which are equipped with silicon diode detectors do not suffer from this limitation. In such instruments, performance limits are usually dependent on the stray light and a quality system will measure absorbance up to 3 A with accuracy and reliability.
Absorbance Measurement
The unwanted effects like spectral bandwidth on peak absorbance are eliminated by constructing the calibration curve at a known concentration. It should obey the Beer's law so that a plot of concentration can be determined. The importance of measuring absorbance precisely at the wavelength of an absorption peak, i.e. at λmax is demonstrated in the below figure. Any wavelength setting within the narrow band indicates that there is no significant effect on the absorbance at the peak. The band of wavelengths displaced to shorter wavelength would be a major error. Wavelength setting or instrument calibration errors will be minimum when measurements are made at the wavelength of maximum absorption.
Importance of measurement at lmax
Solvent Selection
The solvents available show the decrease in the transmission of the shorter wavelengths. Care should be taken when working below 250 nm.
SOURCES OF ERROR
The laboratory requirements should meet the good laboratory practices provided. Validation should be done for instrument, procedure and apparatus. These instrumental errors which are caused by the stray light with improper bandwidth are minimised by the validation process.
Instrument-Related Sources of Error
Spectral bandwidth and slit width: The resolution of spectrometers is increased by the minimisation of separation between the absorption bands and which can be controlled by the following factors:
- Spectral purity.
- Intensity of monochromator light.
- Detector sensitivity over wide range of wavelengths.
- Narrow slit widths.
Spectral bandwidth
The total energy at the exit slit of a monochromator at wavelength λ assumed as a triangular function. The half-peak intensity is defined as the spectral bandwidth for a given slit width. As the ratio of the spectral bandwidth to natural bandwidth increases, the deviation of observed absorbance from true absorbance will be greater. The natural bandwidth of most commonly employed compounds in UV/visible is bio-molecules in the Life Sciences, which lies within the range 5–50 nm. Thus, a spectrophotometer with a fixed bandwidth of 2–6 nm is ideal for bio-molecule measurement. A narrower bandwidth is mandatory for measurements involving rare earth and transition metal complexes. A diagrammatic representation of an absorbing species measured at progressively increasing spectral bandwidths is shown in the below figure. As bandwidth increases beyond the value, separation of the two bands is less, the apparent absorbance at the maxima decreases and the observed bandwidth of the peaks increases.
Typical absorption peaks plotted at varying spectral bandwidths
Effect of slit width on observed absorbance at λmax
Where it is necessary to determine accurately the absorbance at λmax, it may be desirable first to plot apparent absorbance against slit width; figure above shows that slit widths greater than about 0.75 mm may introduce significant error into the measurement of the absorbance concerned.
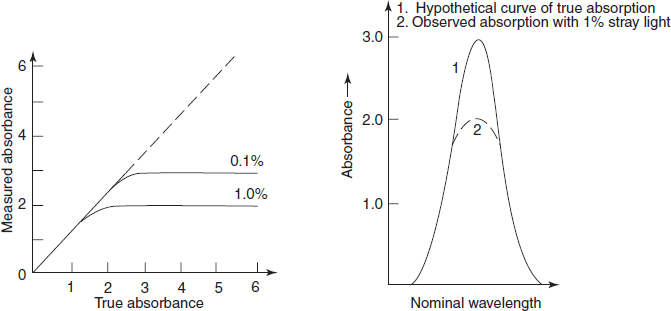
Stray light: Most important error occurred by the instrument is the stray light which is defined as the radiation emerging from the monochromator of all wavelengths other than the bandwidth at the selected wavelength. It is minimised by the removal of extraneous light.
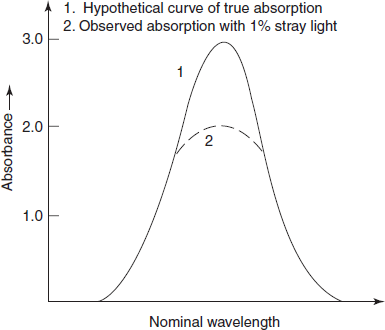
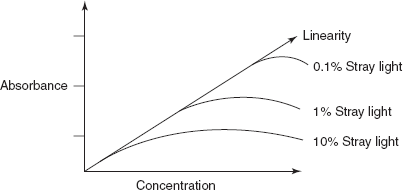
The stray light will cause apparent negative deviations from Beer's law and a level of 0.1% stray light at any wavelength will prevent accurate absorption measurements of greater than 3A. The primary effect of the stray light is to reduce the observed peak height (below figure). Where absorbance is high (e.g., at an absorption peak) or where instrument sensitivity is low (e.g., at the wavelength limits or near 190 nm where atmospheric oxygen absorbs strongly), the errors introduced by the stray light will be relatively enhanced.
Effect of stray light on observed peak height
Absorbance accuracy: The photo detector systems of most modern instruments are linear to less than 1 % by design. Hence, the only factor which has any significant effect on absorbance accuracy is the stray light, which is described above.
Wavelength accuracy: The effects of wavelength inaccuracies are noticed by the measurements taken from absorbance peak, at the absorbance maximum where the rate of change is at a minimum. The A260/A280 ratio used in assessing the purity of nucleic acid preparations, this is not possible and care must be taken in the interpretation of results, especially if the solutions are dilute.
Noise: There is noise which is associated with the fluctuations of the beam reaching the detector where beam energy is low. Noise problems may be reduced by integration with respect to time or by storage and enhancement, and microprocessors are used for this purpose.
Non-instrumental Sources of Error
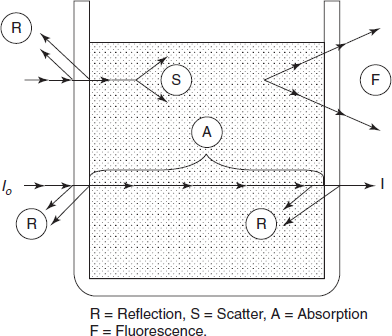
Non-instrumental errors are observed from the nature of the solution to be examined. The effects of temperature or pressure must be maintained. Multi-component mixtures where more than one constituent absorbs at a wavelength are of great interest. Absorbance in these conditions is additive and a Beer's law plot for one component may no longer be possible. The number of absorbances measured at different wavelengths should be equal to the number of components in the mixture. Providing the absorption coefficients of the components are known for each of the wavelengths measured, the equations can be solved algebraically. The several processes that may occur when a beam of radiation meets a cell containing a solution are shown in the below figure.
Total attenuation (i.e. the ratio of I to I0) may include components from the following:
- Reflection of cell and cell interfaces.
- Scattering by suspended particles.
- Absorption by the solution.
- Fluorescent component (result of re emission)
Components of total attenuation process
Non-instrumental errors are minimised by the use of quality sample cells and fluorescence is reduced by chemical inhibition or by the use of cut-off filters.
APPLICATIONS
- Used in the determination of Absorption curve and concentration of a substance.
- Example: KNO3 determination
- Used in the study of substituents effect on the absorption spectrum.
- Example: Comparing the absorption spectrum of benzoic acid with that of 4-hydroxybenzoic acid and 4-aminobenzoic acid
- Used in the simultaneous spectrophotometric determinations.
- Example: Simultaneous determination of mangnese and chronium in steel and other ferro-alloys.
- Used for determination of molor absorption coefficients.
- Used in the analysis of Binary mixtures.
- Example: Benzene-toluene mixture Binary analysis.
- Used in the determination of phenols in water.
- Used in the determination of the cutivee constituents in a medical preperation by derivative spectroscopy.
- Example: Determination of pseudoephedrine and tripolidine in actifed medicinal preperation
- Used in the determination of keto-enol tautomerism.
- Following list of drugs are analysed by UV-visble spectrophotometric method:
EXPERIMENTS
The following experiments specify the use of cuvette and test tubes and explain the adverse optical effects and the nominal path length.
Potassium dichromate stock solution: Weigh 0.93 g of potassium dichromate (K2Cr2O7), record the weight dissolved in the 1 l volumetric flask and add 100 ml of 0.1 N sulphuric acid. Make up the volume to 1 l with distilled water and dissolve the potassium dichromate content by continuous shaking. Calculate the precise concentration by dividing the exact weight of dichromate used by 294.2 (the relative molecular mass of potassium dichromate).
Use the precise weight recorded: In this example, it is assumed to be 0.93 g.
0.93 = 0.0031611294.2
The following are the different concentrations of the stock solution prepared:
- 1 ml of stock solution in 9 ml of distilled water.
- 3 ml of stock solution in 7 ml of distilled water.
- 5 ml of stock solution in 5 ml of distilled water.
- 7 ml of stock solution in 3 ml of distilled water.
- 9 ml of stock solution in 1 ml of distilled water.
- Calculate the concentrations of all dilutions and record them.
Chemicals Required
Potassium dichromate, sodium nitrite and dilute sulphuric acid (0.1 N).
- Calculation of absorbance at λ max and measurement of natural bandwidth: Take 3 ml from the 1 in 9 dilution stock solution in a 10 mm cuvette. Set the wavelength to 325 nm and set the instrument reference level. Place the cuvette containing the prepared dilution in the sample compartment. Record the absorbance. Repeat the procedure at wavelength increments of 10 nm up to 405 nm and record absorbance at each wavelength setting. Plot the results absorbance against wavelength. To determine more precisely the wavelength of maximum absorbance, repeat the measurements from 340 to 360 nm at increments of 5 nm. From the graph, note the wavelength of maximum absorbance for this solution.
- Construction of concentration plots: From the above experiment, take the wavelength maximum and take the transmission values for the different stock solutions. Plot the graphs by taking two plots: one is absorbance against concentration and another one is transmission against concentration. Note that the absorbance plot is linear and that the transmission plot is exponential. And the unknown concentrations are plotted by the pointing the known concentrations. If any absorbance exceeds the 1, then dilute the solution to minimum dilution.
- Testing for the stray light: Make up a solution of sodium nitrite in distilled water at a concentration of 5 g in 100 ml and fill an l0 mm cuvette. Set the wavelength to 340 nm and set the reference (100% T) with a cuvette with distilled water. Then put the cuvette containing the sodium nitrite solution in the sample compartment. Sodium nitrite acts as a blocking filter, absorbing all incident radiation at the wavelength, but transmitting virtually all the radiation at longer wavelengths. Therefore, any transmission recorded at 340 nm will be a direct measurement of the stray light of the instrument. The value should be in accordance with the manufacturer's specification. For some instruments, this could be < 0.05 %.
REVIEW QUESTIONS
- What is the principle involved in the UV/visible spectroscopy?
- What is the theory involved in UV/visible spectroscopy?
- What are different types monochromators used in the UV/visible spectroscopy?
- What are the different transitions involved in the UV spectroscopy?
- What are the different instrumental components of the UV/visible spectrometer?
- What are the applications of UV/visible spectroscopy?
- What are the advantages and limitations of the UV/visible spectroscopy?
- What are the different types of detectors used in the UV/visible spectroscopy?
- Give some examples for the different transitions involving compounds?
- What are the different radiation sources used in the UV/visible spectroscopy?
Comments
Looking for UV, Water based flexo ink and Adhesives supplier in Chennai, India | Siegwerk Inks for your business?
Reach PemoTech Solution.
Water Purifier with Hot Water
Hot and Cold Water Purifier
Undersink Water Purifier
Undercounter Ro System
Water Purifier
Hot Water Purifier